 |
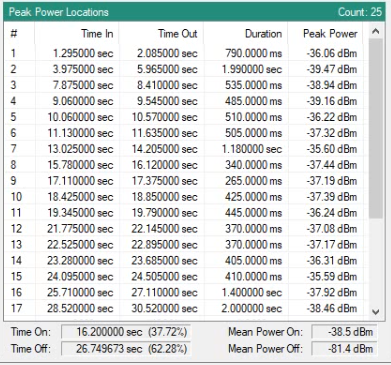
Time In Start time of selected peak from Power vs Time graph. Time Out End time of selected peak from Peak vs. Time graph. Duration Time duration of selected peak time in and time out. Peak Power The peak power of the selected peak from the Power vs. Time graph. Time On Total time duration of signal above the set power threshold (red horizontal line set in power vs. time graph). Time Out Total time duration of signal below the set power threshold (red horizontal line set in power vs. time graph). Mean Power On The mean power value for signals above the set power threshold. Mean Power Off The mean power value for signals below the set power threshold. |