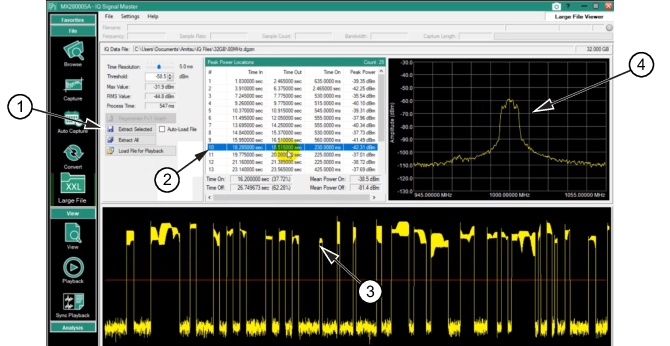
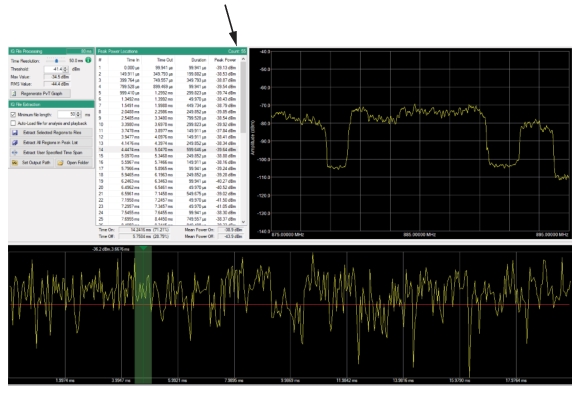
2. Click a Peak Power location from the Peak Power Location table. Once clicked, a view of the peak power signal is displayed in the signal view window. Here, #10 corresponds to the 10th peak power channel in the power vs. time display.
Extract Selected Peak Power Segment
1. Extract selected button
2. #10 peak power selected
3. 10th peak power channel on the power vs. time graph
4. View the 10th peak power channel set.
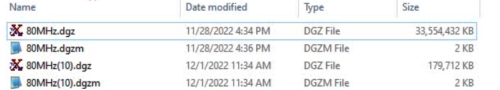
3. Press the Extract Selected button. The file is stored in a user selected file location as shown in Figure: Stores File with (10) to Identify Power Channel Extracted. In this example, the file is stored in the same location of the original file. The original file (80 MHz.dgz) is >33 GB in size. In comparison, and as a result of using the Time Resolution slider to find the peaks of the signal in 5 ms resolution, the 32 GB file is now a time slice of ~180 MB in size.
Stores File with (10) to Identify Power Channel Extracted
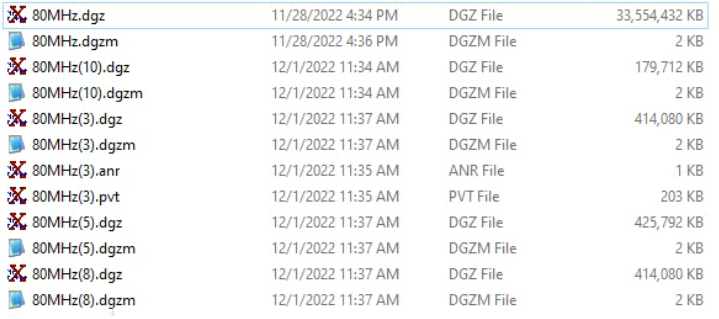
Selecting more files and pressing the Extract Selected button will store the files in the same way as shown in Figure: Select and Store Files.
2. Set the Time Resolution in the Large File menu.
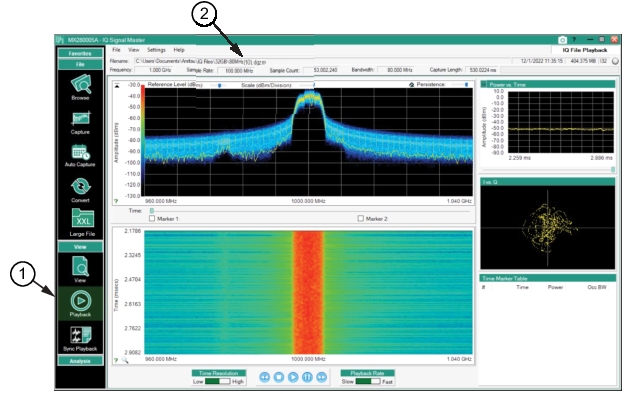
3. Press Load File To Playback. The example below uses the 5 ms resolution to process the 32 GHz file.
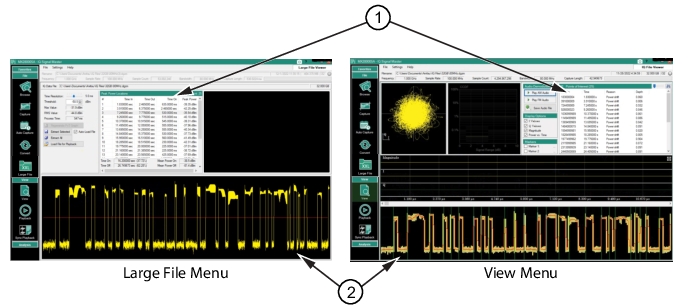
4. Go to the View menu. View menu shows that the Power Peak Locations of the Large File menu opens as Points of Interest in the View menu.
Open View Menu
1. The Large File - Power Peak Locations opens as Points of Interest in the View Menu
2. Power vs. Time
Import Points of Interest
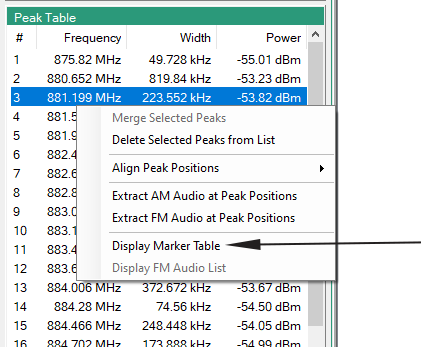
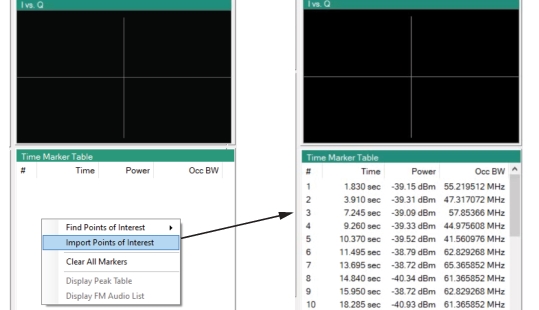
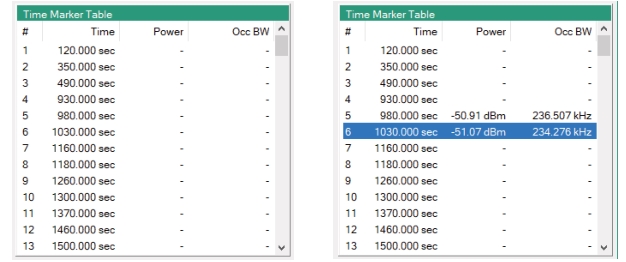
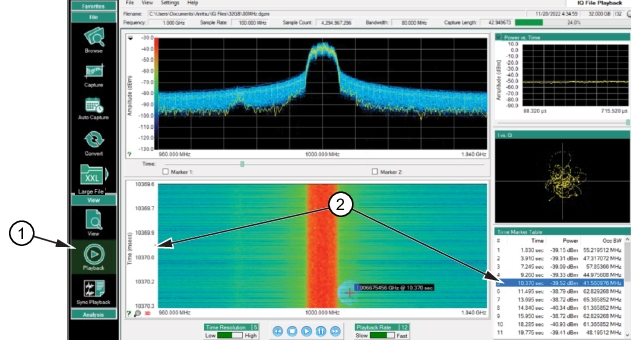
In the Playback menu, right-click in the Time Marker Table and select Import Points of Interest. Large files imported into the Points of Interest table can take several minutes to load. SeeLoad Large File Menu for a description of large file management. Note that the Time Marker Table is a multi-function window and may be in Points of Interest mode. If in the Peak Table mode, right-click to display the context menu and then click Display Marker Table as shown in Figure: Display Marker Table. The Points of Interest are imported into the Playback Time Marker Table as shown in Figure: Playback Menu - Import Points of Interest to Marker Table. When the number of points located is less than 30, all the columns (Time, Power, Occ Bandwidth) are populated with parameter values.
Display Marker Table
Playback Menu - Import Points of Interest to Marker Table
It is not unusual to have several hundred peaks of interest located. In the example shown in Figure: 127 Points of Interest, there are 127 points found.
127 Points of Interest
Importing over 30 points into the Time Marker Table results are shown in Figure: Click to Display Marker Parameters. Click a row to display the Power and Occ Bandwidth column.
Capture several signals from the Large File menu using the Power vs Time display. The example shown in Figure: Capture Multiple Files displays two signals selected in the Power vs. Time display.
Capture Multiple Files
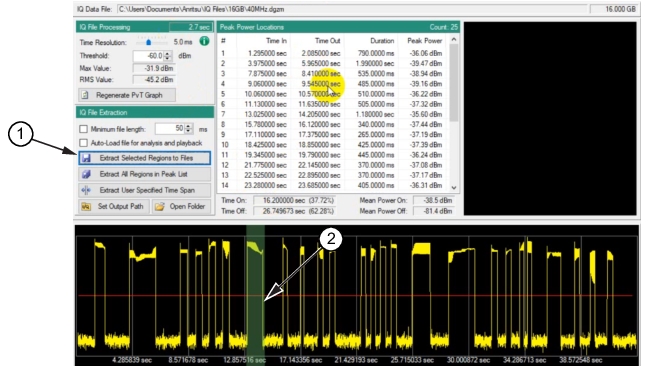
1. Extract Selected Regions to File button
2. Shift-Click and slide mouse over a region of signals
To select and extract multiple peaks:
1. Shift-click-hold and slide the mouse over a region of signals in the Peak Power vs. Time display.
2. Check the Auto-load box.
3. Press Extract Selected to load and view in Playback menu.