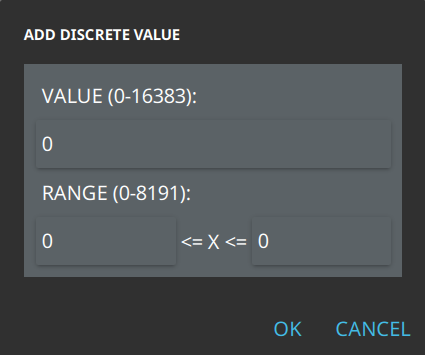
The discrete value method shown in Figure: Add Discrete Value allows a specific value to be set to a range of waveform entries. Once the data is entered, the value is reflected in the waveform drawing. The value entered into the VALUE (0-16383) range sets the Y value. The Value entered into the left tab of the RANGE (0-8191) range is the first X value coordinate. The second value entered into the <= X <= 0 is the second X value of the waveform.
Add Discrete Value
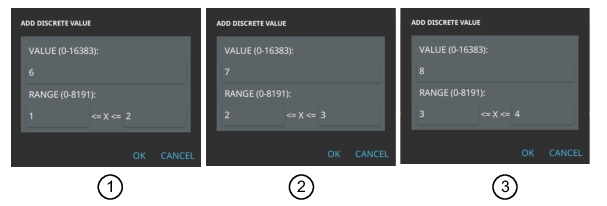
To smoothen edges or to create a waveform that appears rounded will require many points to be added to the waveform graph. An example of starting to draw a curve waveform is shown in Figure: Use Discrete Method to Draw Curve. Continueingon in the pattern shown will provide a linear line upwards. Add variation by decreasing the values in the ADD DISCRETE VALUE dialog.
Use Discrete Method to Draw Curve
1. Starting Point: Y Value = 6, <=X= 1, <=1=2
2. 2nd Point: Y Value = 7, <=X= 2, <=X=3
3. 3rd Point: Y Value = 8, <=X= 3, <=1=4
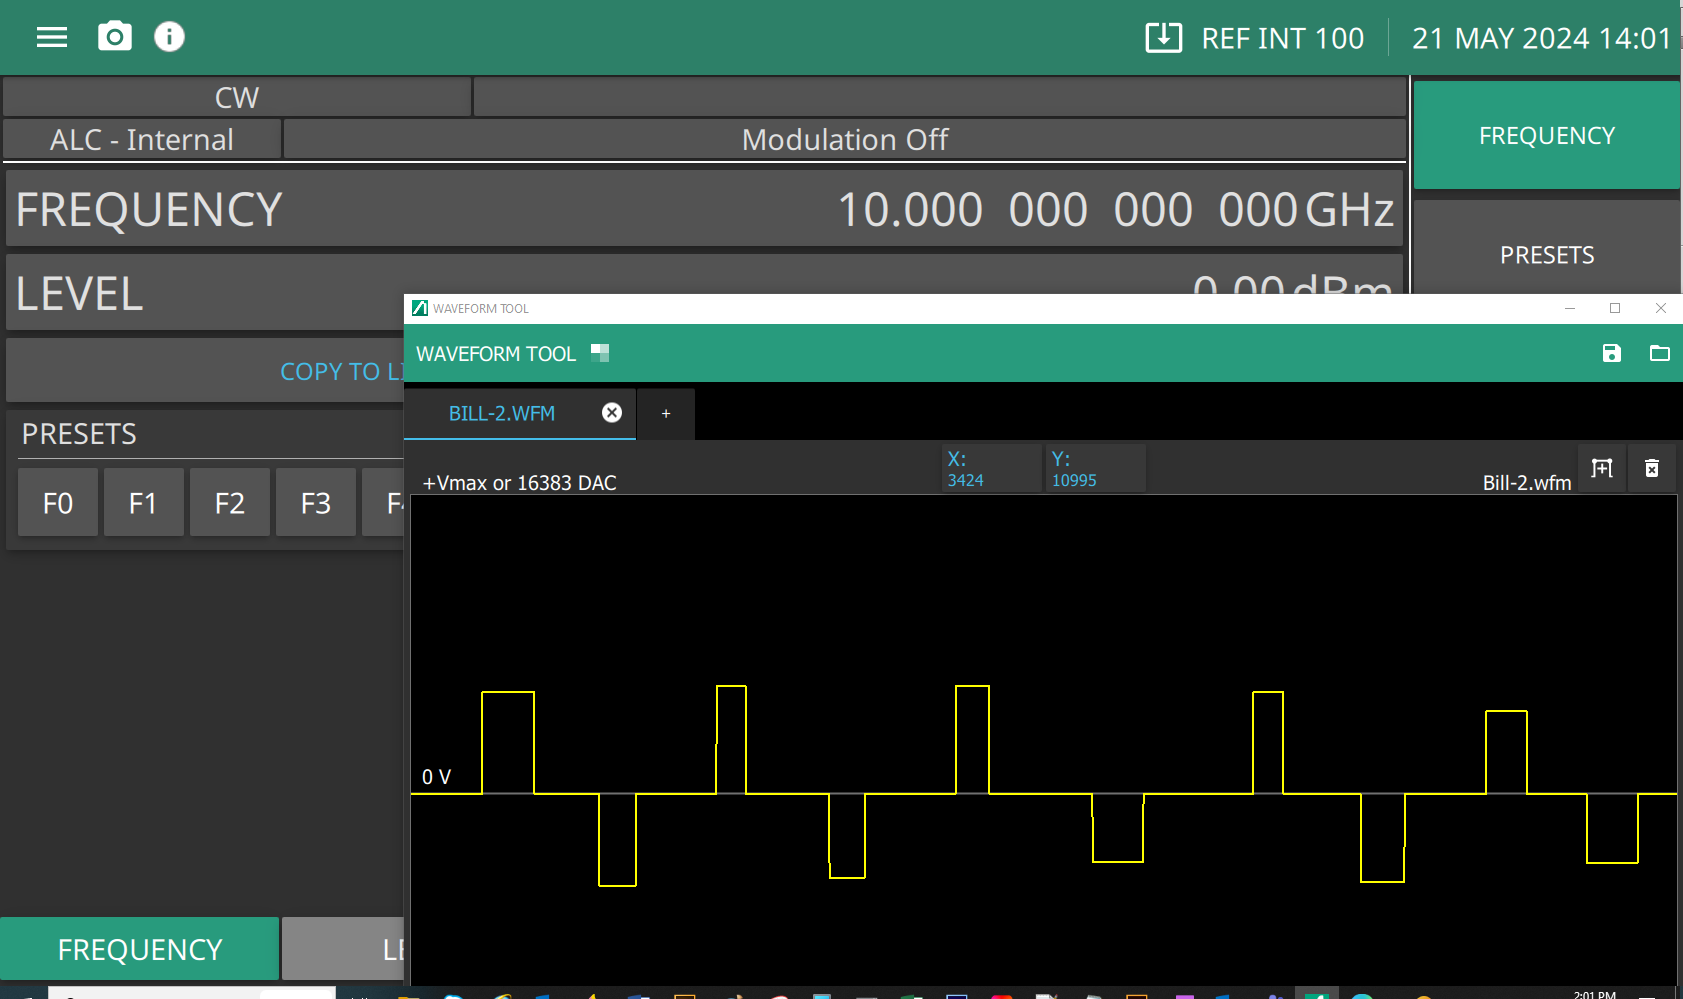
Open Externally
Press the OPEN EXTERNALLY button provides the user a tool to detach the Waveform Generator screen and move to another monitor and allow the user to continue to use the Rubidium UI as shown in