This section describes the Interference Map capability and key characteristics of Interference map measurement mode. This section describes the Interference Map capability and key characteristics of Interference map measurement mode. This technique is used to geo-locate interfering signals with respect to the user’s current location. The user is required to travel with the instrument connected with a GPS receiver, directional antenna and the MA2700A InterferenceHunter to more than one location to capture the triangulation of the interfering signals. The resulting geo-location of the intersecting signals will get captured in the map.
The interfering signal is located by following the steps below:
1. Press system menu (3-line icon in the upper left corner), go to SETTINGS > GPS, and toggle GPS/GNSS on.
2. Press System menu, go to TOOLS > MAP TOOL to download a digital map of the current location. Refer to “Map Tool” section of Instrument Overview chapter of the user guide. Note that Internet connection is required to download the map tiles of the selected location. Ensure to have either an Ethernet or a Wi-Fi connection.
3. Connect the GPS, handheld InterferenceHunter MA2700A and suitable directional antenna (for e.g. Yagi antenna) to instrument.
4. Press MEASURE > MEASUREMENT> Interference Map.
5. Set up the frequency and span in order to view the signal of interest on the spectrum display. Ensure not to make the span too wider, as this slows down the instrument’s response in locating the interfering signal.
6. Press SETUP>INTEGRATION BW and set an appropriate integration bandwidth to measure the channel power of the signal of interest.
7. Press SETUP> VOLUME to increase the instrument’s volume in order to listen for max channel power.
8. Slowly point the directional antenna in the direction leading to max channel power, either press the trigger on MA2700A when pointing in the direction of the maximum power, or press PLACE LINE in SETUP menu. Refer to .
9. Notice that moving the directional antenna will mark a red line on the map, which signifies the direction of max power.
10. To view the interference signal, change the current location to another nearby different location (~1 mile/km).
11. Repeat Step 6 through Step 8 and drop a second red line on the map by clicking the trigger on the MA2700A.
12. Similarly, change the present location to another nearby location and repeat Step 6 through Step 8 to drop a third line on the map. The three lines should intersect at an approximate location of the signal of interest.
13. If needed you can also choose a desired bearing line by selecting an appropriate bearing line from SELECTED LINE drop-down. Refer to .
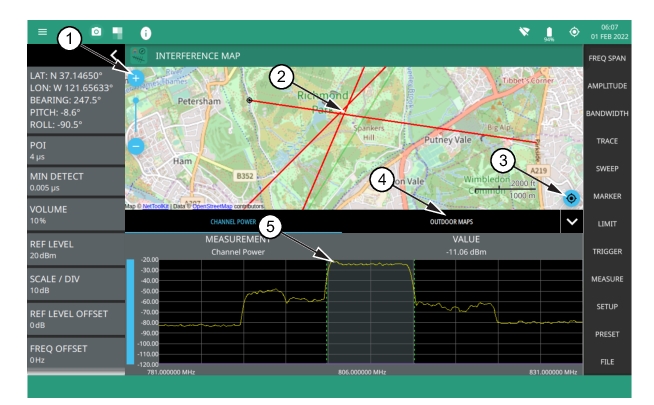
Interference Map Overview
1. The map zoom tool is used to increase (+) or decrease (-) zoom level. You can also drag the zoom level indicator up or down, or you can pinch to change zoom level.
2. Triangulation of all the three Interference signals.
3. Recentering tool to center map on current GPS position. A GPS is required for this icon to appears.
4. Select Outdoor Maps to view the list of saved maps or to create a new map using Map tool.
5. Max channel power.
STATUS Panel (Interference Map and Interference Polar)
This status panel is unique to Interference Map and Interference Polar measurement modes (selected via MEASURE > MEASUREMENT menu) of IA RTSA Application.
STATUS Panel with Mini Status Panel Icons (Interference Map and Interference Polar)
Pressing editable parameters opens the associated menu with a keypad that allows you to conveniently change the parameter value. These are the same settings found in the right side menus.
LATITUDE
Shows the latitude coordinate of the interferer
LONGITUDE
Shows the longitude coordinate of the interferer.
BEARING
Direction the MA2700A is pointing (shown in red).
PITCH (vertical level)
Indicates the front-to-back orientation.
ROLL (horizontal level)
Indicates the side-to-side orientation.
INTERFERER
Shows the latitude and longitude coordinates of the interferer.
POI
Probability of Intercept (POI) is the minimum signal duration that the analyzer can detect at full amplitude with 100% probability.
MIN DETECT
The minimum detection is the minimum signal duration that the analyzer can detect.
VOLUME
Sets the audio output volume.
REF LEVEL
Sets the reference level of the top graticule line in the selected units. If the reference level offset is not zero, OFFSET REF LEVEL is displayed at this location. Refer to Setting Amplitude Parameters.
SCALE/DIV
Sets the graticule scale/division for log-based units. This setting does not apply to linear units.
REF LEVEL OFFSET
Sets the reference level offset in dB units. This setting can compensate for the presence of external input attenuation or gain.
FREQ OFFSET
Accounts for frequency conversions outside of the analyzer. Refer to Setting Frequency Parameters.
ATTEN LEVEL
When auto attenuation is off, sets input attenuation.
PRE AMP
Toggles the low-noise front-end preamplifier on or off. Refer to Setting Amplitude Parameters.
TRACES
Displays the current status of up to six traces or cursors in a quick-view summary. When the measurement view is set to IA RTSA mode trace information is displayed in this area. The summary information includes the trace number, type, mode, and detector type. The active trace will show a highlighted background with the mode and detector type restated under the table. Pressing a trace in the summary panel activates the pressed trace or cursor and opens the TRACE menu, allowing you to select and set up an individual trace or cursor as desired. Refer to Setting Trace and Cursor Parameters. Note that cursor parameters don’t apply to IA RTSA application because there is not spectrogram view.
SWEEP
Toggles the current sweep setting between continuously or sweep once. Refer to Setting Sweep Parameters.
FREQ REFERENCE
Indicates the current frequency reference source of Internal High Accuracy (used after GPS has lost sync, but while the internal clock still has good GPS reference), Internal Standard Accuracy, External, or GNSS (GPS) Hi Accuracy (requires GPS). The instrument automatically selects the frequency reference in the following order of priority: external, GPS, then the internal time base.
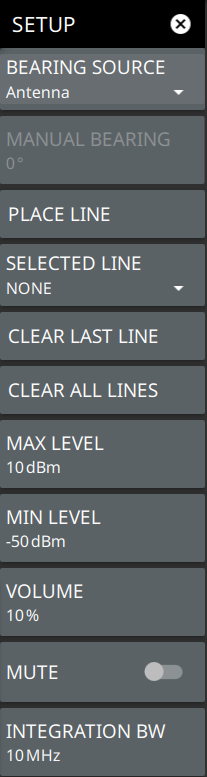
SETUP Menu (Interference Map)
The Interference Map SETUP menu is available in MEASURE > MEASUREMENT > Interference Map> SETUP.
SETUP Menu (Interference Map)
BEARING SOURCE
Selects the bearing source either as antenna or manual. If antenna is selected the electronic compass from the MA2700A InterferenceHunter is used to find the direction of the peak signal. If MANUAL is selected an external compass must be used to find the direction of the power signal.
MANUAL BEARING
Allows the user to manually enter the number of degrees from true north direction of the peak signal. In this case a magnetic compass or a compass App installed in a smart phone can be used to find the direction of the peak signal.
Note that if an antenna that is less than 6 GHz range is used, then an external magnetic compass may be used to find the signal direction. The eCompass in MA2700A does not support in locating high frequency signals. Manual bearing feature is very useful when triangulating signals greater than 6 GHz, as the user is allowed to enter the bearing manually.
PLACE LINE
Places the bearing line data in red on the map, alternatively press the trigger on the MA2700A InterferenceHunter to place the red line on the map.
SELECTED LINE
Selects a desired bearing line of your choice.
CLEAR ALL LINES
Clears all the bearing line data from the map.
MAX LEVEL
Sets the upper level for the audio response of the measurement. This setting is useful for adjusting the resolution of the tone changes. Power levels above the MAX LEVEL will continue to emit sound an increasingly higher pitch.
MIN LEVEL
Sets the lower level for the audio response of the measurement. The MIN LEVEL also functions as a squelch. Power below this level will not emit a sound.
VOLUME
Adjusts the audio output volume.
MUTE
Mutes the instrument volume.
INTEGRATION BW
Sets the range of integration used in calculating the received power. The integration bandwidth is displayed as the shaded region between the bandwidth start and stop thresholds (dashed green lines).