 |
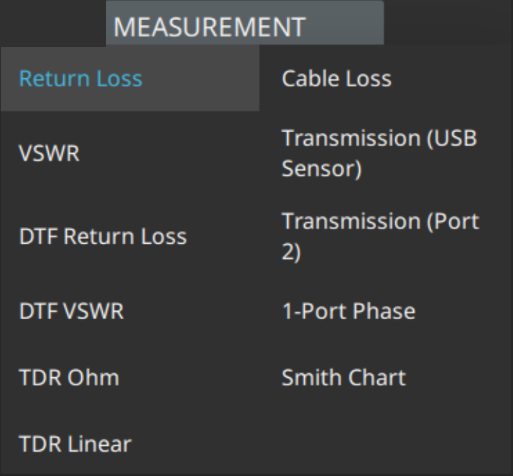
Return Loss Shows the data file as a Return Loss display. The Return Loss display can then be analyzed using the available parameters of the Anritsu Report Tool program. VSWR Shows the data file as a VSWR display. The VSWR display can then be analyzed using the available parameters of the Anritsu Report Tool program. Cable Loss Shows the data file as a cable loss display. The cable loss display can then be analyzed using the available parameters of the Anritsu Report Tool program. DTF Return Loss Shows the data file as a Distance to Fault (DTF) display. The DTF display can then be analyzed using the available parameters of the Anritsu Report Tool program. DTF VSWR Shows the data file as a Distance to Fault (DTF) Voltage Standing Wave Ratio (VSWR) display. The DTF VSWR display can then be analyzed using the available parameters of the Anritsu Report Tool program. TDR Ohm Shows the data file as a Time Domain Reflectometry (TDR) Ohm display. The TDR Ohm display can then be analyzed using the available parameters of the Anritsu Report Tool program. TDR Linear Shows the data file as a Time Domain Reflectometry (TDR) Linear display. The TDR Linear display can then be analyzed using the available parameters of the Anritsu Report Tool program. Transmission (USB Sensor) Shows the data file as a Transmission USB Sensor display. The Transmission USB Sensor display can then be analyzed using the available parameters of the Anritsu Report Tool program. Transmission (Port 2) Shows the data file as a Transmission (Port 2) display. The Transmission (Port 2) display can then be analyzed using the available parameters of the Anritsu Report Tool program. 1-Port Phase Shows the data file as a 1-Port Phase display. The 1-Port Phase display can then be analyzed using the available parameters of the Anritsu Report Tool program. Smith Chart Shows the data file as a Smith Chart display. The Smith Chart display can then be analyzed using the available parameters of the Anritsu Report Tool program. |