 |
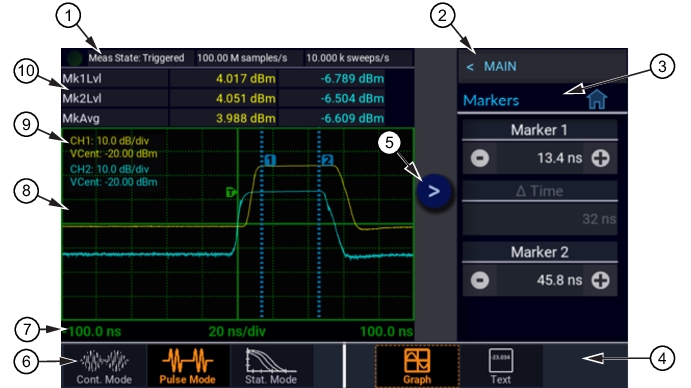
1. Status bar: Indicates the measurement acquisition status of the unit. In Pulse mode, the sample rate and number of sweeps per second are also shown. In Statistical mode, it indicates the gating setting in use, run time, and number of points. 2. Menu Path: Use to navigate the menu structure. Shows the menu that will be displayed when selected. 3. Current Menu/Home: Displays the name of the current menu and provides a home shortcut to the top-level Main menu. When in the Main or top-level menu, this field is not available. 4. Display Mode: Modes available are Graph and Text. The Graph Display mode for Continuous Measure mode will be a flat trace. Use Text Display mode for continuous signal measurements. 5. Menu Bar: Press the touch screen 3-Bar button to show the UI menu and > to hide the UI menus. 6. Measure Mode: Measurement modes are Continuous, Pulse, and Statistical. 7. Horizontal Scale: For Pulse and Continuous mode, indicates the time per division for the waveform display. In Statistical mode, the horizontal scale for the CCDF graph is in dBr (dB relative). 8. Main Display: Displays a plot when Graph display mode is selected. Displays a table of parameters when Text Display mode is selected. 9. Channel Status: Indicates which channels are ON and their individual scale and vertical center. 10. Parameters: Displays a table of measurements for each channel that is enabled on the meter. In Pulse and Continuous mode, measurements indicated are for power levels at each marker and the average power between the markers. For Statistical mode, the measurements are Average power, Maximum power, and Peak-to-Average Ratio or Crest Factor. |