This chapter provides an overview of power/pulse measurement.
Unmodulated Carrier Power
The average power of an unmodulated carrier consisting of a continuous, constant amplitude sinewave signal is also termed continuous wave (CW) power. For a known value of load impedance R, and applied voltage Vrms, the average power is:
P = Vrms²/R (watts)
Power meters designed to measure CW power can use thermoelectric-based sensors which respond to the heating effect of the signal or diode detectors which respond to the voltage of the signal. With careful calibration accurate measurements can be obtained over a wide range of input power levels.
Modulated Carrier Power
The average power of a modulated carrier which has varying amplitude can be measured accurately by a CW type power meter with a thermoelectric detector, but the lack of sensitivity will limit the range. Diode detectors can be used at low power, square-law response levels. At higher power levels the diode responds in a more linear manner and significant error results.
Pulse Power
Pulse power refers to power measured during the on time of pulsed RF signals. Traditionally, these signals have been measured in two steps:
• thermoelectric sensors measure the average signal power,
• the reading is then divided by the duty cycle to obtain pulse power, Ppulse
Ppulse = Average Power/ Duty Cycle, where Duty Cycle = Pulse Width/Pulse Period
Peak Power
The Model ML2439A makes power measurements in a manner that overcomes the limitations of the pulse power method and provides both peak power and average power readings for all types of modulated carriers. The fast-responding diode sensors detect the RF signal to produce a wideband video signal, which is sampled with a narrow sampling gate. The video sample levels are accurately converted to power on an individual basis at up to a 100 MSa/sec rate. Since this power conversion is corrected based upon the sensor’s linearity correction table, these samples can be averaged to yield average power without restriction to the diode square-law region. In addition, if the signal is repetitive, the signal envelope can be reconstructed using an internal or external trigger. The envelope can be analyzed to obtain waveshape parameters including, pulse width, duty cycle, overshoot, rise time, fall time, and droop. In addition to time domain measurements and simple averaging, the Model ML2439A has additional capabilities that perform statistical analysis on a complete set of continuously sampled data points. Data can be viewed and characterized using a CCDF presentation format. These analysis tools provide invaluable information about peak power levels and their frequency of occurrence, and are especially useful for non-repetitive signals, such as those used in 5G and Wi-Fi applications.
Diode Detection
Wideband diode detectors are the dominant power sensing device used to measure pulsed RF signals. However, several diode characteristics must be compensated to make meaningful measurements. These include the detector’s nonlinear amplitude response, temperature sensitivity, and frequency response characteristic. Additional potential error sources include detector mismatch, signal harmonics, and noise.
Detector Response
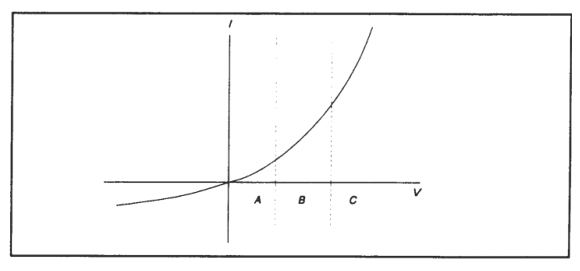
The response of a single-diode detector to a sinusoidal input is given by the diode equation:
The curve indicates that for low microwave input levels (Region A), the single-diode detector output is proportional to the square of the input power. For high input signal levels (Region C), the output is linearly proportional to the input. In between these ranges (Region B), the detector response lies between square-law and linear.
For accurate power measurements over all three regions, the detector response is pre-calibrated over the entire range. The calibration data is stored in the instrument and recalled to adjust each sample of the pulse power measurement.
Temperature Effects
The sensitivity of microwave diode detectors (normally Low Barrier Schottky diodes) varies with temperature. However, ordinary circuit design procedures that compensate for temperature-induced errors adversely affect detector bandwidth. A more effective approach involves sensing the ambient temperature during calibration and recalibrating the sensor when the temperature drifts outside the calibrated range.
This process can be made automatic by collecting calibration data over a wide temperature range and saving the data in a form that can be used by the power meter to correct readings for ambient temperature changes.
Frequency Response
The carrier frequency response of a diode detector is determined mostly by the diode junction capacitance and the device lead inductances. Accordingly, the frequency response will vary from detector to detector and cannot be compensated readily. Power measurements must be corrected by constructing a frequency response calibration table for each detector.
Mismatch
Sensor impedance matching errors can contribute significantly to measurement uncertainty, depending on the mismatch between the device under test (DUT) and the sensor input. This error cannot be easily calibrated out, but can be minimized by employing an optimum matching circuit at the sensor input.
Signal Harmonics
Measurement errors resulting from harmonics of the carrier frequency are level-dependent and cannot be calibrated out. In the square-law region of the detector response, section A of Figure: Ideal Diode Response, the signal and second harmonic combine on a root mean square basis. The effects of harmonics on measurement accuracy in this region are relatively insignificant. However, in the linear region, section C of Figure: Ideal Diode Response, the detector responds to the vector sum of the signal and harmonics. Depending on the relative amplitude and phase relationships between the harmonics and the fundamental, measurement accuracy may be significantly degraded. Errors caused by even-order harmonics can be reduced by using balanced diode detectors for the power sensor. This design responds to the peak-to-peak amplitude of the signal, which remains constant for any phase relationship between fundamental and even-order harmonics. Unfortunately, for odd-order harmonics, the peak-to-peak signal amplitude is sensitive to phasing, and balanced detectors provide no harmonic error improvement.
Noise
For low-level signals, detector noise contributes to measurement uncertainty and cannot be calibrated out. Balanced detector sensors improve the signal-to-noise ratio by 3 dB, because the signal is twice as large.