To set the sweep parameters, press the Shift key and then the Sweep (3) key.
Single/Continuous
When this submenu key is pressed, the instrument toggles between single sweep and continuous sweep. In single sweep mode, after the sweep the instrument waits in Hold mode until the Manual Trigger submenu key is pressed or another triggering mode is selected.
Sweep Mode
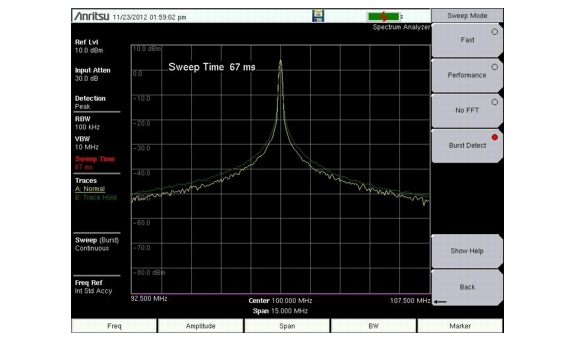
Several sweep modes are available on the instrument. Press the Sweep Mode submenu keys to select between Fast (default), Performance, No FFT, or Burst Detect.
Improperly installed cellular boosters can produce interference that is sometimes bursted. Some bugs use burst transmission to make them hard to find. By using Burst Detect mode, a narrow pulsed or bursty signal is easily seen in spectrum analyzer mode. Emitters as narrow as 200 μs can be captured every time. Burst Detect works in a maximum span of 15 MHz.
Figure: Example of Burst Detect Sweep Mode shows two traces. The yellow one is the live trace with Burst Detect sweep mode, while the green one is a max hold trace. Note that there isn’t much difference between the two traces. No longer is max hold needed to be able to see narrow pulsed signals.
Example of Burst Detect Sweep Mode
The Show Help submenu key displays a table detailing the trade‑off between sweep speed and performance of the sweep mode options.
Note
Sweep Mode menu functionality varies based on instrument model. Fast is the default sweep mode for instruments that have received the new instrument calibration from Anritsu.
Trigger Type
To select a specific type of triggering in zero span, press the Triggering submenu key followed by the Source submenu key. Selections are:
Free Run: The default trigger type is “Free Run” in which the instrument begins another sweep as soon as one is finished.
External: A TTL signal applied to the External Trigger BNC input connector causes a single sweep to occur. This mode is used in zero span, and triggering occurs on the rising edge of the signal. After the sweep is complete, the resultant trace is displayed until the next trigger signal arrives.
Video: This mode is used in zero span to set the power level at which a sweep is initiated. The power level can be set from –130 dBm to +30 dBm. Trigger is based on the measured signal level. The sweep triggers when the signal level crosses the trigger level with a positive slope. If no signal crosses the trigger level, the last trace on the screen, before video triggering was selected, will be displayed. To change the video triggering level use the rotary knob, enter the desired amplitude with the keypad, or use the left or right arrows to change the setting by 1 dB or the up or down arrows to change the setting by 10 dB.
IF Power (not available on all instruments): This mode is used in zero span to use IF power level as the trigger source. The power level can be set from –130 dBm to +30 dBm, using the rotary knob, arrow keys, or keypad. The trigger is based on the measured signal level. If no signal reaches or exceeds the trigger level, then no trace will be on the screen.
Zero Span IF Output (Option 89): Zero Span IF Output provides an IF signal that is nominally at 140 MHz out of a BNC female connector labeled IF Out 140 MHz or IF Out (option) 140 MHz.
Note
The IF output signal is present only when the spectrum analyzer Span is set to zero and the Zero Span button has been pressed a second time to bring up the IF bandwidth menu (refer to Zero Span IF BW Menu). The key sequence is: Span > Zero Span > Zero Span.
Note
MS2723B and MS2724B instruments use IF frequency of 37.8 MHz rather than the 140 MHz of other Anritsu Spectrum Masters. IF output bandwidth is limited to 16 MHz. For these MS2723B and MS2724B instruments, the BNC connector is labeled IF Out 37.8 MHz.
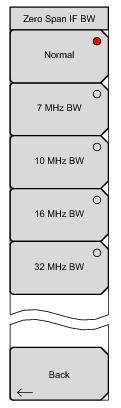
You can select Normal or any one of four fixed IF bandwidths of 7 MHz, 10 MHz, 16 MHz, or 32 MHz. In Normal, the bandwidth is set by the spectrum analyzer RBW selection (BW > Zero Span RBW). When Normal is selected, the IF bandwidth is influenced by the selection of RBW filters, although the digital RBW filters themselves are not employed.
Zero Span IF output effectively uses the spectrum analyzer as a receiver front‑end, converting the input signal at the spectrum analyzer RF In connector to a signal centered at 140 MHz out of the IF Out 140 MHz connector. You can then process the IF signal in a way that meets your needs. That may mean using an A‑to‑D converter or some other signal processing method. An anti‑aliasing filter can be employed in the signal processing to reduce the effect of noise and spurious signals. A filter centered on 140 MHz with a bandwidth slightly wider than 32 MHz is also advised to eliminate any undesired out‑of‑band signals on the IF output. In particular, signals at 100 MHz and its harmonics (that would be eliminated by the filter) are on the IF output.
With Option 89, IF output is turned on by setting the instrument to zero span and pressing the Zero Span submenu key a second time to access the Zero Span IF Bandwidth menu (Figure: Zero Span IF Bandwidth Selection Menu).
Zero Span IF Bandwidth Selection Menu
The Normal IF BW choice selects a bandwidth that uses analog bandpass filters in the normal RBW chain. By changing the RBW, different filter bandwidths are selected.
The spectrum analyzer has several mixer bands. Depending on the operating frequency, the local oscillator may be above or below the input frequency. When the local oscillator frequency is below the input frequency, an increase in the input frequency results in an increase in the IF output frequency. When the local oscillator is above the input frequency an increase in the input frequency moves it closer to the local oscillator frequency and the IF output frequency consequently decreases. Table: Mixer Bands and LO Relation to RF Frequency shows the bands and indicates where the LO frequency is in relation to the RF frequency.
Mixer Bands and LO Relation to RF Frequency
Band
Low RF MHz
High RF MHz
Local Oscillator Side
Output Spectrum
1
0
5350
High
Inverted
2
5350
9200
High
Inverted
3
9200
13000
Low
Not Inverted
4
13000
16500
High
Inverted
5
16500
20000
Low
Not Inverted
6
20000
32800
High
Inverted
7
32800
43000
Low
Not Inverted
“Inverted” means that the IF is spectrally inverted from the input (as the input frequency goes higher, the IF goes lower).
“Not Inverted” means that the IF is not spectrally inverted (as the input frequency goes higher, the IF goes higher).
You need to take frequency inversion into account when processing the IF signal. Assuming that the IF has been processed to yield I and Q data, inversion is easily done by swapping I and Q.
A residual frequency offset of the IF may exist compared to the RF due to the resolution of the 1st and 2nd local oscillators. Usually this offset will be on the order of several kHz. To determine the residual offset, you need a second spectrum analyzer:
1. Attach a signal source (or antenna) to the spectrum analyzer and set the center frequency to the center of the signal being received.
2. Press BW then Zero Span, and then press Zero Span a second time to turn on the IF output.
3. Attach a second spectrum analyzer to the IF output and set the center frequency to 140 MHz. Set the span of the second spectrum analyzer to 100 kHz or less to have the resolution needed to be able to measure an offset that may be 25 kHz or less.
4. Measure the frequency of the IF signal to see how far the signal is offset from 140 MHz.
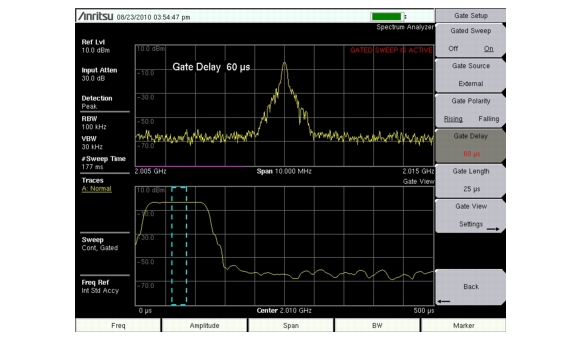
Gated Sweep Setup (Option 90 Only)
The Gated Sweep function allows the user to view the spectrum of a signal that has been gated in time. This is useful for measuring signals that are bursty in the time domain (pulsed RF, time multiplexed, burst modulated, etc.). Pressing the Gated Sweep Setup submenu key toggles the instrument to a dual graph view that displays the spectrum of the signal in the top graph and the time domain/zero span view of the same signal in the bottom graph. This allows the user to setup the gate length and gate delay using the zero span view in the bottom graph while simultaneously viewing the spectrum in the top graph. The Gate View Settings button shows a submenu that allows the user to independently set the RBW, VBW and sweep time for the zero span view. The “gate” is visually displayed as a blue dashed rectangle (Figure: Gated Sweep Example)and is controlled by the Gate Delay and Gate Length values. Once the gate has been setup, the user can apply gating to the spectrum by setting Gated Sweep to On. Gating will continue to be applied to the spectrum when you press Back and access other measurements and functions of the spectrum analyzer until either: (1) Gated Sweep is explicitly set to Off or (2) the Span setting is changed to Zero Span mode.