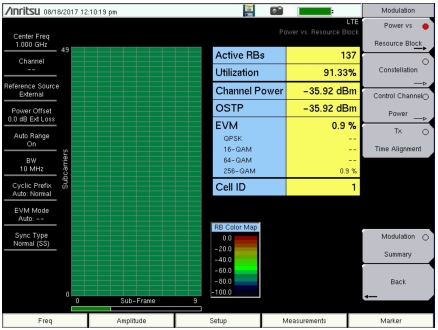
Shows the PDSCH power of each RB using color. The y‑axis is frequency (sub‑carriers) and the x‑axis is time (sub‑frame). There are ten columns for the ten sub‑frames. The number of subcarriers varies depending on the bandwidth chosen and hence the number of RBs on the y‑axis. Each cell in the grid corresponds to a particular RB in a particular sub‑frame. As the measurement progresses, each sub‑frame is measured and the cells in the grid are colored according to the PDSCH power in the RB.
Resource Block Color Map
The color mapping of the RB power level is determined by the RB Color Map Max Value and RB Color Map Range submenus. Setting these values can be done by entering them manually or by pressing Autoscale Color Map.
Note
The Power Offset is applied to the measured value before matching to a color map.
Measurements Table
Active RBs The number of active Resource Blocks. A RB is determined to be active if the measured PDSCH power is above a certain threshold that indicates that the RB is being used for carrying data.
Utilization The percentage of RBs that carry data. It is the number of Active RBs divided by the total number of RBs, expressed as a %.
Channel Power Channel power is the average total power within the bandwidth and is expressed in dBm.
OSTP OSTP is the measurement of the OFDM symbol transmit power.
EVM The RMS (%) of all of the error vectors between the reconstructed ideal signals and the received signals, divided by the RMS value of the ideal signals. Individual frame EVM(RMS) is displayed for the modulation types QPSK, 16-QAM, and 64-QAM. If the LTE carrier uses 256-QAM modulation scheme, the corresponding EVM measurement result is displayed, provided Option 886 is installed and activated on your instrument (see Figure: Power versus Resource Block Measurement View).
Cell ID Cell identifying information sent by the transmitter in the sync signal.
Measurement Progress Bar
This progress bar indicates the sub‑frame that is currently being measured.
Markers
Markers are available for use in the Power vs Resource Block measurement. The markers will outline the selected RB. Above the two-dimensional grid, the specific RB subcarrier/sub‑frame coordinates will be displayed along with its power level.
Constellation
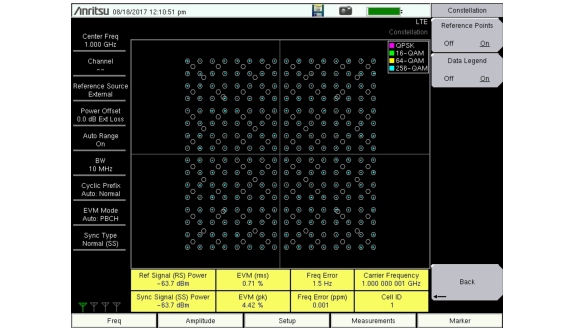
This measurement displays the constellation of the demodulated symbols over the first sub‑frame and a results table of the measurements described below. See Figure: Constellation Measurement View.
Ref Signal (RS) Power
Reference Signal power displayed in dBm or Watts. The reference signal is used for downlink channel estimation.
EVM (rms)
The RMS (%) of all the error vectors, between the reconstructed ideal signals and the received signals, divided by the RMS value of the ideal signals. When EVM Max Hold is On (Setup menu), two values are displayed. The first number is the maximum EVM (rms) value since Reset and the second number is the current measured value. Reset occurs when setup parameters are changed or by toggling the EVM Max Hold button.
Freq Error
The difference between the measured carrier frequency and the specified carrier frequency is the frequency error. This number is only as accurate as the frequency reference that is used, and is typically only useful with a good external frequency reference or GPS.
Carrier Frequency
Carrier Frequency is the measured transmitter operating center frequency.
Sync Signal (SS) Power
Sync signal power displayed in dBm or Watts.
EVM (pk)
The peak (%) of all the error vectors, between the reconstructed ideal signals and the received signals, divided by the RMS value of the ideal signals. When EVM Max Hold is On (Setup menu), two values are displayed. The first number is the maximum EVM value since Reset and the second number is the current measured value.
Freq Error (ppm)
Freq Error displayed in parts per million (ppm).
Cell ID
Cell identifying information sent by the transmitter in the sync signal.
Control Channel Power
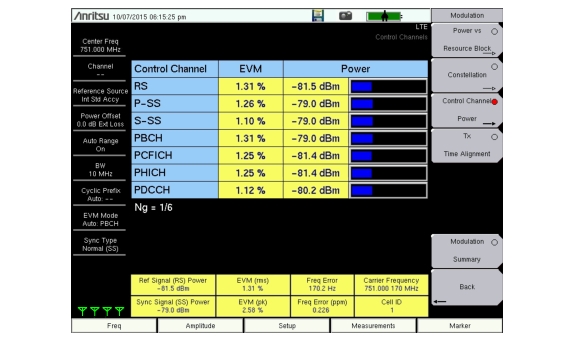
This measurement shows the power levels of key physical layer Control Channels and also includes the numerical results table described in the Constellation section above. EVM per control channel is also available (see Figure: Control Channel Power), as well as a table view showing the power in both per-resource-element and total power formats. Refer to Control Channel Power Menu.
Ref Signal (RS) Power
Reference Signal power displayed in dBm. The reference signal is used for downlink channel estimation.
P‑SS Power
Primary Sync Signal power displayed in dBm or Watts. The primary sync signal is used to obtain slot synchronization. It contains information needed for cell search.
S‑SS Power
Secondary Sync Signal power displayed in dBm or Watts. The secondary sync signal is used to obtain frame synchronization and cell identity. It contains information needed for cell search.
PBCH Power
Physical Broadcast Channel Power. This physical channel carries system information for user equipment (UE) requiring access to the network.
PCFICH Power
Physical Control Format Indicator Channel Power. This channel provides information to enable the UE to decode the PDCCH and PDSCH channels.
PHICH Power
Physical Hybrid Automatic Repeat Request Indicator Channel. Transmits the channel coded HARQ indicator codeword used for error correction.
PDCCH Power
Physical Downlink Control Channel.
Ng
Ng is a parameter that determines the number of PHICH (Physical Hybrid ARQ Indicator Channel) groups in a LTE sub-frame (this number is constant for all sub-frames).
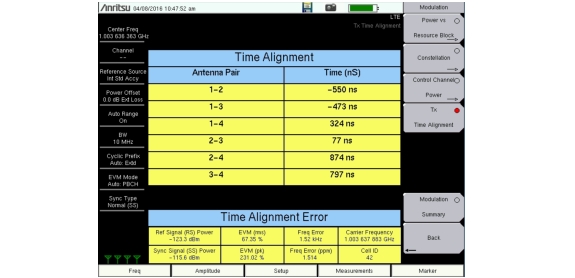
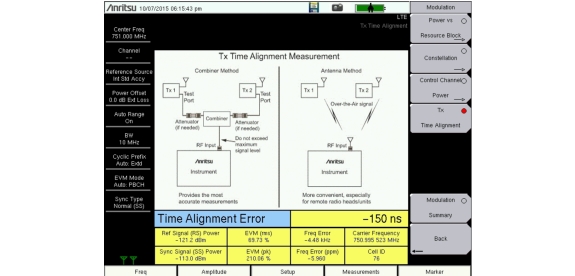
Tx Time Alignment
Measures the delay between the signals from two antennas at the antenna ports.
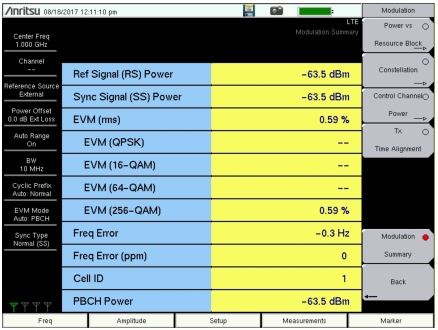
Modulation Summary
Modulation Summary displays the Ref Signal (RS) Power, Sync Signal (SS) Power, EVM (rms), Freq Error (Hz and ppm), Cell ID and PBCH Power in a table format. Refer to individual modulation measurement descriptions for additional detail on each measurement.
Modulation Measurement Setups
Power vs Resource Block
1. Press the Measurements main menu key.
2. Press the Modulation submenu key.
3. Press the Power vs Resource Block submenu key to activate the Power vs Resource Block measurement view.
In the figure below, note that EVM measurement result for 256-QAM modulation type is displayed only when Option 886 is installed on your instrument.
Power versus Resource Block Measurement View
4. Press the Power vs Resource Block submenu key again to display the Power versus RB menu for setting up the RB Color Map maximum value and range. Press a submenu key to change the desired parameter, or press the Autoscale Color Map key to automatically set the Max and Range values.
5. Press the Back submenu key to return to the Modulation menu.
Note
Values shown in the Power vs Resource Block measurement display pertain to the data subcarriers. This is useful in the monitoring of changes in traffic loading on the base station. To measure the power levels of the physical layer Control Channels, use the Control Channel Power measurement.
Markers
1. While in the Power vs Resource Block measurement, press the Marker main menu key. The RB Marker submenu opens. The Marker State button default value is On, so the markers highlight a row of sub‑frames and a column of sub‑carriers.
2. To immediately find the strongest resource block, press the Peak Search key.
3. To choose a specific resource block, press the Marker RB # submenu key and move it to the desired RB # using the arrow buttons, knob, or enter a RB number and press Enter.
4. To select a sub‑frame, press Marker Sub‑frame and move it to the desired sub‑frame using the arrow buttons, rotary knob, or enter the sub‑frame number and press Enter.
Constellation
1. Press the Measurements main menu key.
2. Press the Modulation submenu key.
3. Press the Constellation submenu key to activate the Constellation measurement view.
4. Press the Constellation key again to display the Constellation menu and enable or disable the reference constellation points and the data legend (see Figure: Constellation Measurement View).
a. Press the Reference Points submenu key to turn the reference points on or off.
b. Press the Data Legend submenu key to turn the data legend on or off.
Constellation Measurement View
Note
Support for 256-QAM modulation as shown in the data legend above is available only with Option 886.
5. Press the Back submenu key to return to the Modulation menu.
Control Channel Power
1. Press the Measurements main menu key.
2. Press the Modulation submenu key.
3. Press the Control Channel Power submenu key to activate the Control Channel Power display (Figure: Control Channel Power). Press the key again to view or change the Display Mode and Control Channel EVM settings.
Control Channel Power
4. Press the Back submenu key to return to the Modulation menu.
Tx Time Alignment
1. Press the Measurements main menu key.
2. Press the Modulation submenu key.
3. Press the Tx Time Alignment submenu key to set the modulation measurement to Tx Time Alignment view. The instrument display lists the Time Alignment measurement results and the TAE values for each antenna pair. See Figure: Tx Time Alignment (4x4 MIMO Configuration). If your instrument is loaded with older firmware that does not support 4x4 MIMO, the display may look similar to Figure: Tx Time Alignment.
4. Press the Back submenu key to return to the Measurements menu.
Tx Time Alignment (4x4 MIMO Configuration)
Tx Time Alignment
Modulation Summary
1. Press the Measurements main menu key.
2. Press the Modulation submenu key.
3. Press the Modulation Summary submenu key to activate and display the modulation measurements in table format (Figure: Modulation Summary).
Modulation Summary
4. Press the Back submenu key to return to the Measurements menu.