2. The Graph Type submenu key shows the graph type of the active window. Press this key to display the Graph Type Selector and change the type.
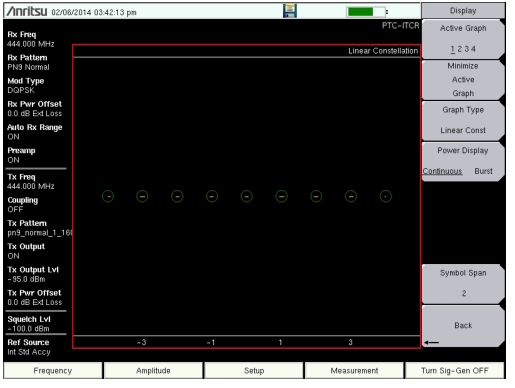
Constellation and Linear Constellation
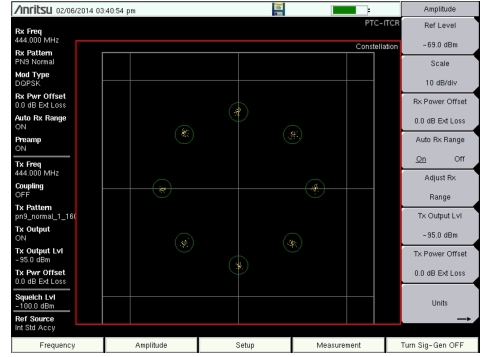
Constellation view displays the demodulation information in an IQ format (Figure: Constellation Diagram). The chart shows the relationship between the location of a constellation data point, its deviation frequency, and the information it carries.
For input signals that are not PTC encoded, the LMR Master will still try to decode them and fit them to a symbol. This may cause some unexpected measurement results.
Spectrum Graph
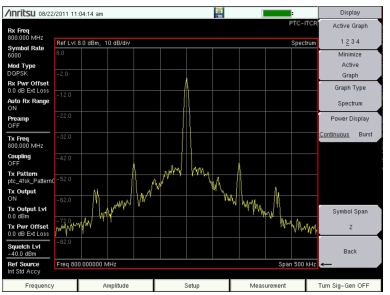
The Spectrum view displays a graphical representation of power (dBm) vs. frequency. The Spectrum display gives an indication if there are interfering entities present that may degrade the bit error rate of the PTC signal. The frequency span is adjustable under the Frequency menu. The reference level is adjusted with the Amplitude menu. Refer to Amplitude Menu for details. Figure: PTC-ITCR Spectrum Graph (25 kHz Span and 500 kHz Span) displays the same signal using a 25 kHz span and a 500 kHz span.
PTC-ITCR Spectrum Graph (25 kHz Span and 500 kHz Span)
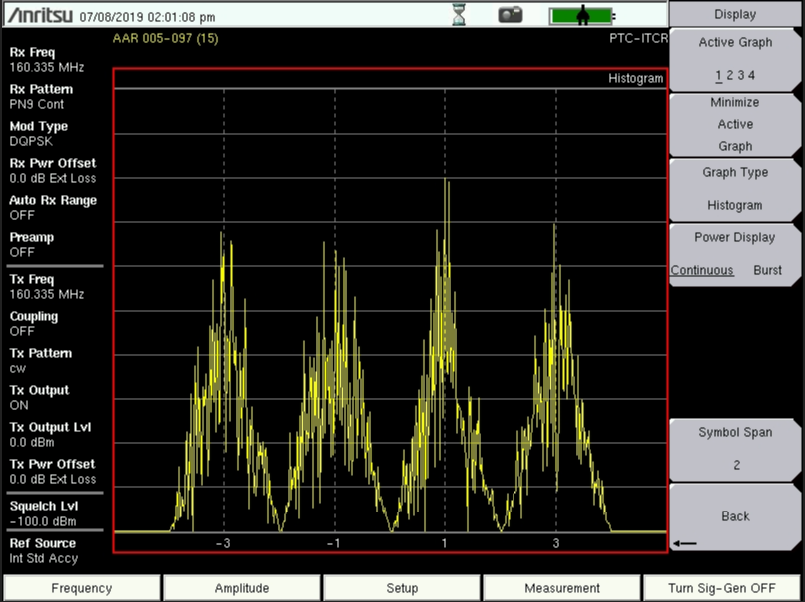
Histogram Graph
The Histogram graph displays a graphical representation of the symbols that are being received. The graph for each symbol represents the relative percentage that symbol was identified out of all the received symbols.
Each update of the screen is a separate representation of the latest data, rather than a cumulative total. The vertical scale is fixed at 0 to 100 %, with each horizontal grid line representing 10 % of the total symbols received.
PTC-ITCR Histogram
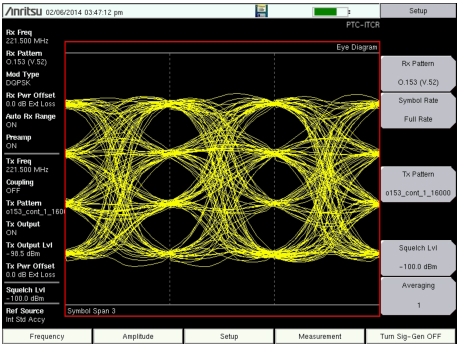
Eye Diagram
The eye diagram is an oscilloscope view of the PTC-ITCR signal displaying the voltage of the signal vs. time. The diagram provides an indication of baseband fidelity of a PTC transmitter. With Over‑the‑air measurements the Eye Diagram can indicate phase distortion from multipath. The number of “eyes” displayed is set with the Symbol Span key under the Display Menu.
PTC-ITCR Eye Diagram
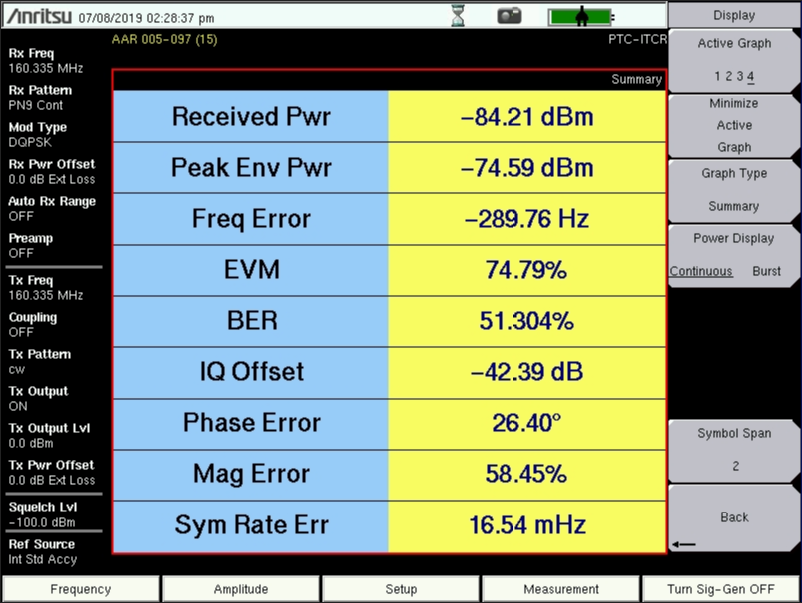
Summary Table
The Summary Table provides an overview of a PTC transmitter. The table displays received power or burst power, peak envelope power (PEP), frequency error, error vector magnitude (EVM), bit error rate (BER), IQ offset, phase error, magnitude error, and symbol rate error of the input signal.
The received power and PEP values in the Summary Table can be changed between dBm, watts, and volts using the Amplitude > Units > Rx Units submenu key. This setting also applies to the burst power and squelch level setting. Press the Power Display key to toggle between displaying the received power (continuous) or the burst power.
The Setup > Squelch Lvl submenu key sets the received power level below which Summary Table results are not displayed. When the received power is lower than the set squelch level, all measurement values except for received/burst power will be blanked out (--) in the summary table. When the received power is above the squelch level, the measurements will display as shown in Figure: PTC-ITCR Summary Graph.
PTC-ITCR Summary Graph
Received power in the Summary Table is the integrated power of all the energy in the receiver bandwidth. Any peak amplitude reduction seen in the Spectrum display when compared to Received Pwr is a function of the RBW setting of the instrument. The reduction is specified as: 10*Log (Signal Bandwidth / Resolution Bandwidth). Burst power in the Summary Table is calculated only when the data stream contains packets.