 |
|
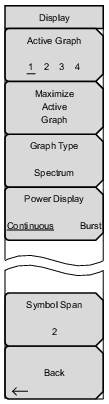 | In Standard view (one graph displayed on the screen – refer to Maximize Active Graph key) the Active Graphic key rotates active focus among the four graphs that are displayed in the Four‑Screen view. Graph Type The label on the bottom of this key displays the current active graph type. Pressing the key opens a list box of the graph types available for PTC Analyzer measurements. Select the desired graph type with the Arrow keys or rotatory knob, and then press Enter. The current, active graph will be replaced with the new selection. Available graphs include: Constellation Spectrum Histogram Eye Diagram Linear Constellation Summary Refer to PTC-ITCR Analyzer Graphs for additional information. Power Display Continuous Burst Depending on their configuration, PTC-ITCR radios emit signals as either a continuous data stream or a burst/packet stream. Pressing this submenu key toggles between Continuous or Burst power measurement mode. In Continuous mode, Received Power is calculated as the integrated power over time. In Burst mode, Received Power is calculated only when the data stream contains packets. Note: Selection of Continuous mode when analyzing burst/packet signals produces artificially low values for Received Power. The magnitude of this error is a function of the burst/packet duty cycle. Symbol Span Use this menu to adjust the number of symbols viewed across the screen in the Eye Diagram graph. Adjust from 2 and 5 using the keypad, the arrow keys, or the rotary knob. Keypad values entered outside of this range are ignored. Back Returns to the Measurement Menu. |