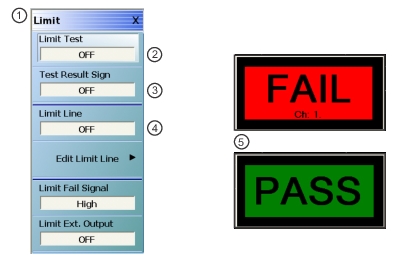
2. Limit Test Toggle Button – Toggles limit tests ON or OFF.
3. Limit Test Results Sign Button – Toggles limit test results as screen message as shown in #5 ON and OFF.
4. Limit Line Toggle Button – Toggles existing limit lines ON or OFF.
5. Pass/Fail screen dialogs showing results of test.button function descriptions.
Limit Test (Off/On)
On a per-system basis, select toggles Limit Test on and off.
Test Result Sign (Off/On)
On a per-system basis, toggles the Test Result Sign on and off. If the Test Result Sign is enabled, a failed test icon appears. If the Test Result Sign is enabled, a passed test icon appears.
Limit Line
On a per-trace basis, toggles Limit Lines off and on.
Edit Limit Line
On a per-trace basis, displays the Edit Limit Line menu.
On a per-trace basis, toggles the Limit Fail Signal between high and low.
Limit Ext. Output (Off/On)
Select toggles the Limit Ext. Output between off and on.
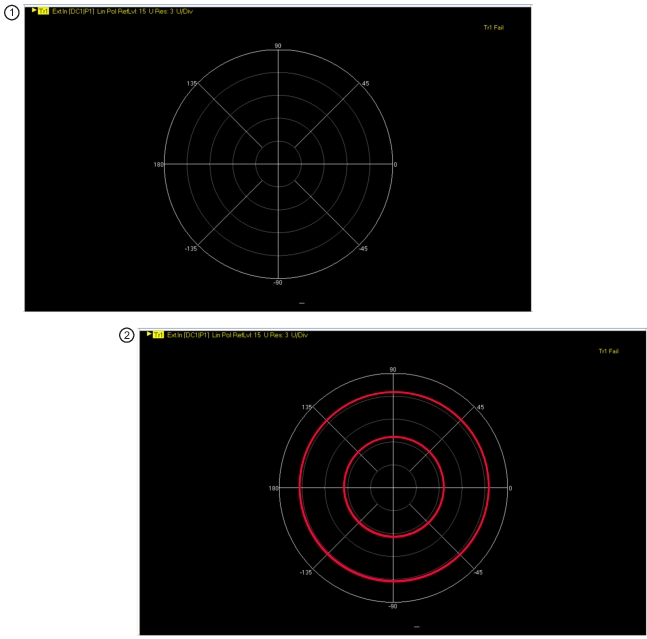
Polar Chart Circular Limit Lines
For Linear Polar Chart displays and Log Polar Chart displays, only upper and lower limit lines are supported. For example, in Figure: Linear Polar Display – Limit Lines – Off/On, a Linear Polar display at left has the limit lines turned off, and at right, the limit lines are turned on.
Linear Polar Display – Limit Lines – Off/On
1. Linear Polar Display – Limit Lines Off
2. Linear Polar Display – Limit Lines On.
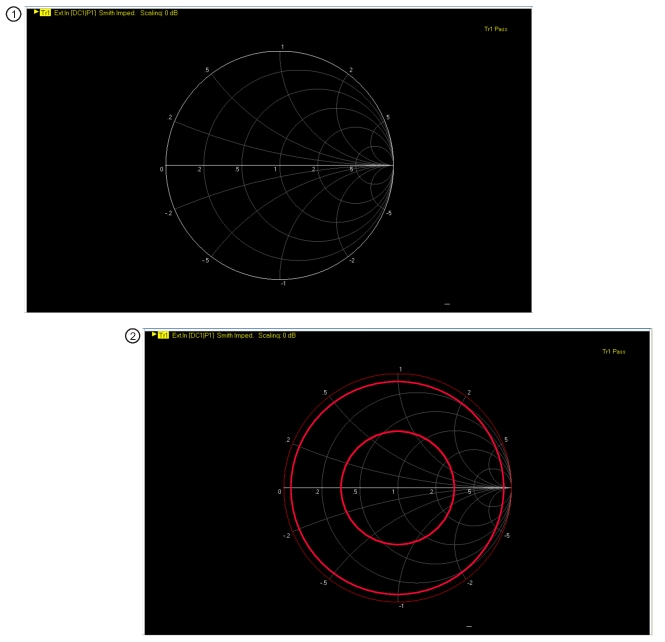
Smith Chart Circular Limit Lines
For Smith Charts, again only upper and lower limits are supported. In Figure: Smith Chart Limit Lines – Off at left – On at right, a Smith Chart with the limit lines turned off is shown on the left, and with the limit lines turned on at the left.
Smith Chart Limit Lines – Off at left – On at right
1. Smith Chart Limit Lines – Limit Lines OFF
2. Smith Chart Limit Lines – Upper and Lower Limit Lines ON.
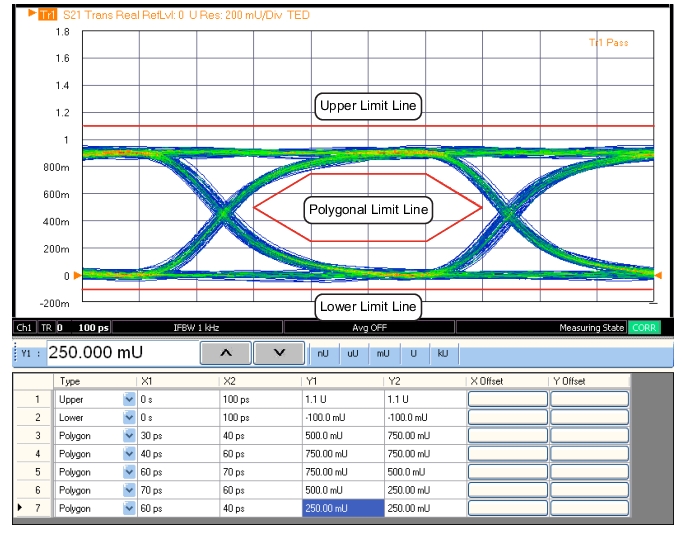
Eye Diagram Display with Polygon Limit Lines
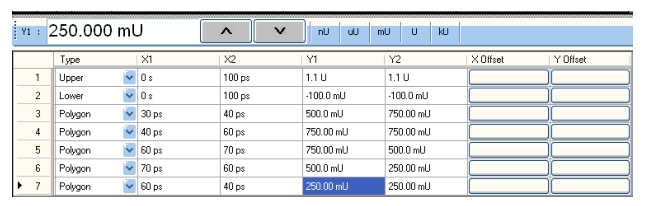
When Option 47 is installed and the selected trace is Time, Eye Diagram (TED), the limit line table is modified to include the selection Polygon as a limit line type.
Performance limit lines applied for Domain | Time, Eye Diagram displays are known as “Masks”. The user must enter a minimum of three entries corresponding to Polygon type in the limit line table in order to consider it as a mask. Only then will limit checking be done for polygon mask. The polygon must be closed and simple (no lines crossing). The segments of the polygon should be entered sequentially (clockwise or counterclockwise) so the system can figure out which region to enclose.
Eye Diagram Limit Lines
Polygon Mask Limit Definitions:
Upper Limit Line: All eye data should fall below the upper red line. The upper red line denotes the maximum expected value. Voltages exceeding this value are considered a fail.
Lower Limit Line: All eye data should fall above the lower red line. The lower red line denotes the minimum expected value. Voltages below this value are considered a fail.
Polygon Limit Line: Here the limit line entries are considered vertices of a polygon. In order to pass the mask compliance test, the output must not have any samples fall within the “keep-out” regions (the polygon area defined by the mask). That is, failures fall inside of the polygon.
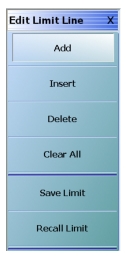
EDIT LIMIT LINE Menu
When this menu is selected, the bottom of the display moves up and the Limit Line Type Setup Table is displayed. The number of limit lines that can be added depend on the type of display:
• Single rectangular trace displays can have up to 50 limit line segments per trace.
• Dual rectangular trace displays can have up to 50 limit line segments where each segment is the same on both trace displays.
• Smith Chart and Polar Graph circular displays are can only have an upper and lower limit.
• MAIN | Display | DISPLAY | Trace Limit Lines | LIMIT | Edit Limit Line | EDIT LIMIT LINE
EDIT LIMIT LINE Menu
EDIT LIMIT LINE Menu Button Availability
The six (6) buttons of the EDIT LIMIT LINE menu are available to all rectangular, Smith Chart, and Polar Graph Chart displays.
Rectangular displays can have up to 50 limit line segments per trace. Smith Chart and Polar Graph circular displays can have an upper and lower limit only.
Add (Limit Line)
Select adds a new row of limit line information to the Limit Line Type Setup Table at the bottom of the display. For example, if four (4) limit lines are displayed, selecting Add creates a new limit line at position five (5).
Inserts a new limit line ABOVE the currently selected limit line.
• If no limit lines are currently defined, the button does not function.
• If one (1) or more limit lines are defined, select and highlight the limit line where you want to insert a new line. A selected line is indicated by the right-facing triangle will all line fields in a reversed display.
• For example, if four (4) lines are currently defined, and a fifth line is required between Limit Line 1 and Limit Line 2, select Limit Line 2 so that the right arrow selection triangle appears to the left of the line number.
• Click the Insert button and a new limit line appears at position two with the default values from the active trace display. The cursor moves to the row above the inserted line. The previous line 2 and its values are moved to the row 3 position; the previous line 3 and its values are moved to the row 4 position.
• See the detailed tableau operations description in the sections below.
When the EDIT LIMIT LINE menu is selected, the LIMIT LINE TYPE SETUP Tableau Dialog appears at the bottom of the display allowing creation of limit lines for each trace display. Both upper- and lower-segmented limits can be created by using the buttons in the EDIT LIMIT LINE menu and the segment controls in the tableau dialog.
• MAIN | Display | DISPLAY | Trace Limit Lines | LIMIT | Edit Limit Line | EDIT LIMIT LINE
Limit Line Parameters
The following eight parameters are used to define each limit line:
• Limit line segment number
• Limit line type. Each segment can be defined as an Upper limit, a Lower limit, or turned off.
• X1 = The X-axis segment start frequency.
• X2 = The X-axis segment stop frequency.
• Y1 = The Y-axis starting constraint for the segment. The units for Y1 change depending on the trace display type. For example, if the display is set Log Magnitude, the Y1 units are in dB. If the display is set to Power Out, the Y1 units are in dBm.
• Y2 = The Y-axis stopping constraint for the segment. As above, the Y2 units change depending on the trace display type.
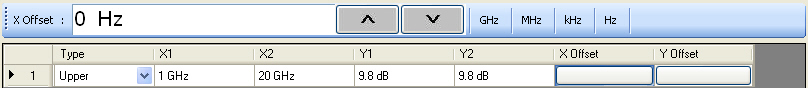
• X Offset = The offset from the X1 value. This is useful if copying existing limit line segments where an incremental offset can be applied to a fundamental X1 value. Any offset is applied to both the X1 and X2 values.
• Y Offset = The offset from the Y1 value. As above, the offset is applied to both the Y1 and Y2 values.
Adding the First Limit Line
Assuming that no limit lines have been added during the current session, the dialog area appears as just a title bar. If unwanted limit lines from a previous configuration appear, on the EDIT LIMIT LINE menu, click the Clear All button.
Adding a Limit Line Row
On the EDIT LIMIT LINE menu, click Add. A default limit line appears in the tableau at row 1.
Type Selection Field
In the Type field, click the down button icon to select whether the limit will be an Upper, Lower, or Polygon limit line or if it will be OFF. The Polygon limit line is used when the display Domain mode is Time, Eye Diagram. This is active when Option 47, Eye Diagram is installed. The segments of the polygon should be entered sequentially (clockwise or counterclockwise) so the system can figure out which region to enclose.
The OFF function is useful if you use a saved limit line file and want to temporarily disable some limits.
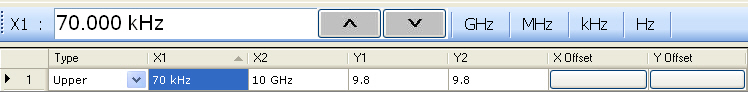
X1 Field
In X1 column, click the X1 field which constrains the start point for the X-axis segment. Usually this will be frequency for linear, log, or segmented frequency-based sweeps. Alternatively, the units can be time (time domain) or power (CW power sweeps).
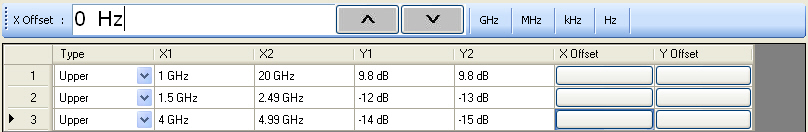
X1 Field Toolbar
As shown above, the X1 field toolbar appears immediately above the tableau header row. If the units are frequency, enter the required X1 frequency, using the field toolbar buttons to select the required units of GHz, MHz, kHz, or Hz. If the units are time or power, the general operation is the same.
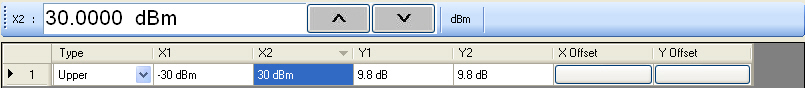
X2 Field
In the X2 column, click the X2 field which constrains the end point for the X-axis segment. As above, the X2 field toolbar appears immediately above the tableau header row with units of frequency, time, or power.
X2 Field Toolbar
As shown above, use the toolbar to enter the required X2 value and units.
Y1 Field
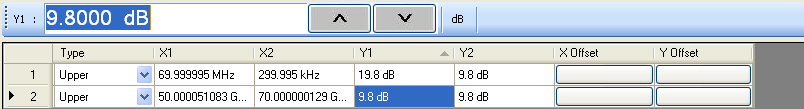
The Y1 and Y2 fields constrain the limit segment in the trace display Y-axis. The units used will match those of the selected trace display. In the Y1 column, click the Y1 field. The Y1 field toolbar appears immediately above the header row.
Y1 Field Toolbar
As shown above, use the toolbar to enter the Y1 value and units.
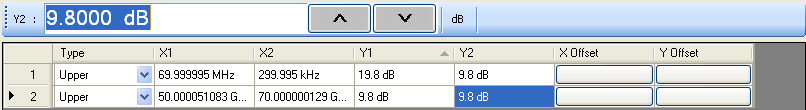
Y2 Field
In the Y2 column, click the Y2 field. As above in the Y1 field, the Y2 field toolbar appears immediately above the header row.
Y2 Field Toolbar
As shown above, use the field toolbar to enter the required Y2 value and units.
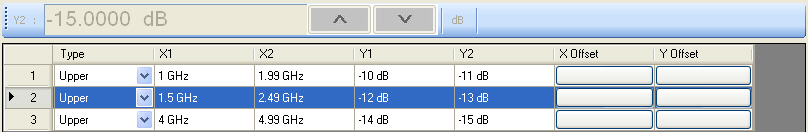
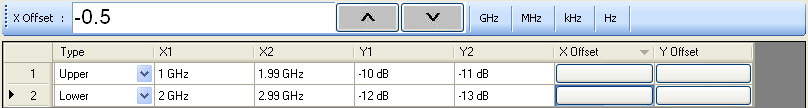
X Offset Button
On a per-row basis, the X Offset and Y Offset buttons allow the user to offset indices by a constant amount. This is useful for copying multiple rows and incrementing by a fixed frequency offset. In the X Offset column, click the X Offset button for the appropriate row. The X Offset field toolbar appears immediately above the tableau header row. Use the toolbar to enter the required value and units. When the units button is selected, the offset is applied to the X1 and X2 values. In the example in row 2 below, a lower limit line has already been established for X1 = 2.0 GHz and X2 = 2.99 GHz. To offset these by the same amount, select row 2, and then click the X Offset button. In the example, the offset required is –0.5 GHz. With row 2 selected, click the X Offset button and the X Offset field toolbar appears. Enter the required value and units.
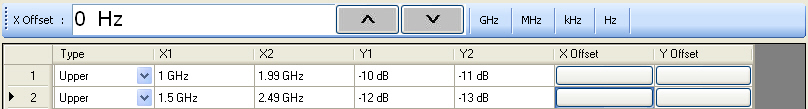
X Offset Field Toolbar
As shown above, use the field toolbar to enter the required X Offset value and units. Once the toolbar units button has been selected, the new X values in row 2 are X1 = 1.5 GHz and X2 = 2.99 GHz as shown below.
Y Offset Button
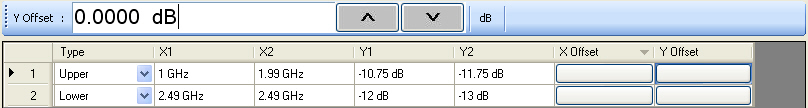
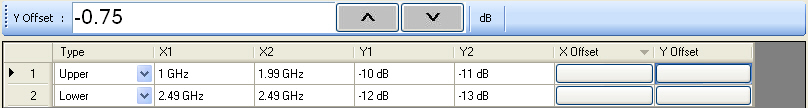
The Y Offset button and field toolbar function the same as the X Offset button described above. Under the Y Offset column heading, click the Y Offset button. The Y Offset field toolbar appears immediately above the tableau header row. In the example below, in the example in row 1 below, a lower limit line has already been established with Y1 = –10 dB and Y2 = –11 dB. To offset these by the same amount, select row 1, and then click the Y Offset button. In the example below, the offset required is –0.75 dB. With row 1 selected, click the Y Offset button and the Y Offset field toolbar appears. Enter the required value and units.
Y Offset Field Toolbar
As shown above, use the field toolbar to enter the required Y Offset value and units. Once the units button has been selected, the Y1 and Y1 fields for row 1 are changed as shown below.
Adding a Limit Line Row
To add more rows to the bottom of the Limit Line Type Setup Table area, use the Add button on the EDIT LIMIT LINE menu and then complete the X1, X2, Y1, Y2, and offset parameters as described above.
If no rows are present, Add creates a new row 1 at the top of the tableau using the trace settings for X1 start and X2 stop values.
• If one or more rows are present, the Add button places each new row at the bottom of the tableau.
• If no rows are present or the field of an existing row is selected, the Insert does not function.
• If one or more rows are present and the entire row is selected by selecting the row number, Insert adds a row at the cursor position and pushes the current row and all those below down.
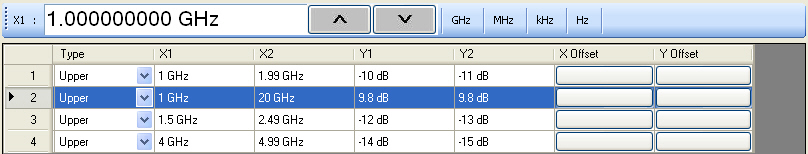
Inserting a Limit Line Row
To insert a limit line row, at least two limit lines must be present. If multiple limit lines are present, select the limit line row number where the new limit line is to be inserted. In the example below, a new limit line is needed above row 2. Row 2 is selected indicated by the highlighting and the right arrow.
On the EDIT LIMIT LINE menu, click the Insert button. A new row is added as row 2 and the previous rows are pushed down as shown below.
After the row is inserted, use the procedures above to complete the X1, X2, Y1, Y2, and offset parameters.
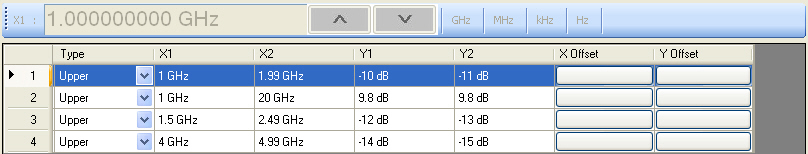
Deleting a Limit Line
To delete a limit line, select it as above, and then on the EDIT LIMIT LINE menu, select the Delete button on the EDIT LIMIT LINE menu. In the example below, row 1 is selected and ready to be deleted.
After the Delete button is selected, the row is removed and all rows below move up as shown below.

 .
.