S‑parameters are a measure of the ratio of two complex voltage levels, one measured by the port receiver, and one measured by the reference receiver. S‑parameters therefore consist of unitless complex numbers.
Depending on the application, S‑parameters can be displayed in many ways and can be used to calculate other parameters. S‑parameters consist of real and imaginary numbers. More typically, however, they are represented as magnitude and phase. In most cases, the magnitude is displayed in dB (this term is often called log magnitude). We can display phase as “linear phase”. With phase, we cannot tell the difference between one cycle and the next. After going through 360 degrees, we are back to where we began. We can display the measurement from – 180 degrees to + 180 degrees, which keeps the phase transition point at the top and bottom edges of the display and away from the important 0 degrees area that is used as the phase reference.
The S820E supports the following display types. Each type is associated with a particular S‑parameter:
(where j is the square root of –1).
Log Magnitude
Applications
To measure return loss at Port 1 (or Port 2), use the Log Mag display with S11 (or S22).
To measure the gain or loss in a DUT that is connected between Port 1 and Port 2, use the Log Mag display with S21 or S12.
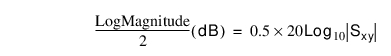
Log Magnitude / 2
Applications
For measuring 1‑port cable loss, use S11 or S22 with the Log Mag / 2 display type to account for the round trip signal path through the cable. When using reflection data to measure cable loss, the end of the cable must be shorted or must be a perfect open.
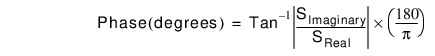
Phase
Applications
Use the Phase or Unwrapped Phase measurement to display the phase in degrees of Sxy. The Phase measurement is contained within a vertical scale of ±180_degrees, whereas the unwrapped phase displays the linear phase without wrapping it at the 180_degrees transitions. See Figure: Unwrapped Phase Compared with Phase. Unwrapped phase is obtained by counting the number of transitions of the phase measurement (note the vertical scale in the figure). Unwrapped phase will be accurate only if the measurement has enough data points to capture all of these transitions. Also, the first data point must be low enough in frequency so that its phase is less than 180_degrees from DC, otherwise the unwrapped phase measurement will have errors.
Real and Imaginary
Applications
Use the Real and Imaginary graph types to measure the elements of the complex S‑parameter Sxy.
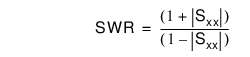
SWR
Applications
SWR, or Standing Wave Ratio, is a measure of the reflection from the DUT input port or output port, and it must be used, therefore, with S11 or S22.
Group Delay
Group Delay (sec) = rate of change of phase over a specified frequency aperture
Applications
Group Delay is a measure of the time delay of the signals that are propagating through the DUT versus frequency (using S21 or S12). Group delay is a good measure of phase distortion through the DUT.
Smith Chart
Smith Chart = graphical tool for plotting impedance or admittance data versus frequency
Applications
Use Smith Chart with S11 or S22 to plot the input or output impedance of the DUT.
Use the Inverted Smith Chart to plot admittance data.
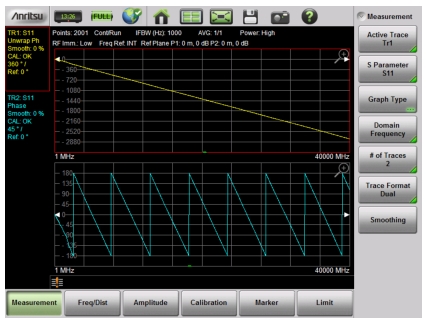
Phase versus Unwrapped Phase Graph Types
Two S11 measurements are shown in Figure: Unwrapped Phase Compared with Phase, one using graph type Unwrapped Phase, and one using graph type Phase. The standard Phase plot displays the phase with its natural wrap‑around every 360 degrees (or within a display range of ±180 degrees). The Unwrapped Phase graph removes the wrapping and plots the phase linearly. Unwrapped phase is obtained by counting the number of transitions of the phase measurement. Note the vertical scales of these two measurements in the figure. The Unwrapped Phase display can be useful for measuring the length of a device in degrees of phase.
Unwrapped phase will be accurate only if the measurement has enough data points to capture all of these transitions. Also, the first data point must be low enough in frequency so that its phase is less than 180 degrees from DC, otherwise the unwrapped phase measurement will have errors.