1. Frequencies F1 and F2 must be within the ranges that are defined in Table: PIM Master Carrier Bands and Frequencies. If an incorrect entry is made, then an error message appears to indicate the allowable frequency range for F1 or F2.
2. Press the Measurements main menu key and then press the PIM vs. Time submenu key.
3. Verify that the Output Power is set to the desired power level.
4. When configuring the test for two-port PIM, remove the cable 2000-1990-R. The bottom of the graphic display on the PIM Master 700 shows whether the instrument is in one- or two- port mode.
Intermodulation Distortion
The intermodulation distortion (IMx) is a mathematical function of F1 and F2.
3rd Order Intermodulation (IM3) = 2F1 – F2 or 2F2 – F1 5th Order Intermodulation (IM5) = 3F1 – 2F2 or 3F2 – 2F1 7th Order Intermodulation (IM7) = 4F1 – 3F2 or 4F2 – 3F1
Example Intermodulation Calculation
Finding IM3 when F1 = 1930 MHz and F2 = 1990 MHz:
IM3 = 2F1 – F2 = 2(1930) – 1990 = 1870 MHz
or
IM3 = 2F2 – F1 = 2(1990) – 1930 = 2050 MHz
The PIM Master uses 1870 MHz (low‑side IMx) as the center frequency. The PIM Master always uses the lower IMx value and does not set it to the high‑side IMx frequency, except for instruments that are designed to measure the high‑side product (the MW82119B‑0700, for example).
If the IMx frequency does not fall within one of these bands, then the PIM Master displays a warning message indicating the acceptable IMx range. The font color for the IMx frequency in the PIM summary table changes to red until acceptable frequency selections are made.
1. Press the Carrier F1 submenu key to enter the frequency of Carrier F1 by using the keypad or the Arrow keys. When entering a frequency by using the keypad, the submenu key labels change to GHz, MHz, kHz, and Hz. Press the appropriate unit key.
3. Press the Intermod Order submenu key so that the desired intermodulation frequency order to be viewed is underlined. 3rd order is the most commonly chosen measurement .
Note
The PIM Parameters screen (press the PIM Aid submenu key) displays the IM frequencies for the F1 and F2 frequencies that are entered.
Amplitude Setup
1. Press the Amplitude main menu key to display the Amplitude menu.
2. Press the Reference Level submenu key. The numeric value and units turn red indicating that the settings are ready for editing. Enter the desired reference level by using the keypad or the Arrow keys. Press Enter.
3. Press the Scale submenu key to change the division of the graticule to a setting other than the default value of 10 dBm.
4. Press the Auto Range submenu key so that On is underlined. This allows the reference level to be adjusted automatically.
5. Press the Amplitude Tone submenu key to have the PIM Master broadcast a tone. The frequency of the tone increases as PIM level increases.
Power and Display Setup
1. Press the Setup main menu key to display the Setup menu.
High Output Power and Low Output Power submenu keys are available for setting output power.
2. Press the High Output Power submenu key to set the output power range between 37 dBm and 46 dBm.
3. Press the Low Output Power submenu key to set the output power range between 20 dBm and 37 dBm.
4. Press Test Duration to set the number of seconds from 1 s to 1200 s.
5. Press the Trace Mode submenu key (if desired) to toggle between Fast and Low Noise modes. For additional information, refer to Trace Mode.
Sample Measurement
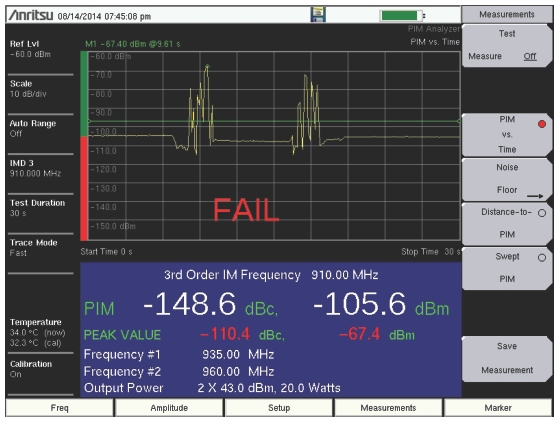
Sample Measurement with PIM at 910.0 MHz
PIM problems can be intermittent and power sensitive. This is often the case when PIM problems first begin to appear. This can be due to light corrosion, to high traffic loading, or to changing weather conditions that are activating environmental diodes. Using higher power levels can often force otherwise intermittent failures to become visible. Higher power levels may be required to find faults in a multi-carrier system or to discover microscopic arcing in connectors.
In Figure: Sample Measurement with PIM at 910.0 MHz, note that the instantaneous PIM levels in the PIM Summary Table are displayed in white numerals even though the PIM value exceeded the upper limit line setting during the measurement. The instantaneous measurement values turn red while the measurement is above the limit, but return to white while the measurement is below the limit. The peak PIM values are shown in red (and remain in red) because the measurement exceeded the limit at some time during the measurement.