 |
|
Icon | Description |
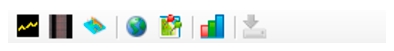
 | Trace View Click provides Trace View only display. |
 | View Trace and Spectrogram Splits the Viewing display into Trace View and Spectrogram View. |
 | 3-D Spectrogram Click provides 3-D Spectrogram display. |
 | Monitor map Click provides a map overview and a Locator of the trace monitor. Floating the mouse over the indicator provides the host name of the monitor. |
 | Breadcrumbs Map |
 | Power vs Time Click provides a bar graph representation of the power vs. time of the selected traces. To set markers and view time stamp, see Power vs Time Markers. |
 | Export Click to Export coverage mapping details to KML file. |