Channel Scanner Measurement Guide : Channel Scanner Measurements : MEASURE Menu (Mapping View)
 
MEASURE Menu (Mapping View)
Select mapping view from MEASURE >VIEW > Mapping. This Measure menu is unique only to Mapping view.
MEASURE Menu - Mapping View
 
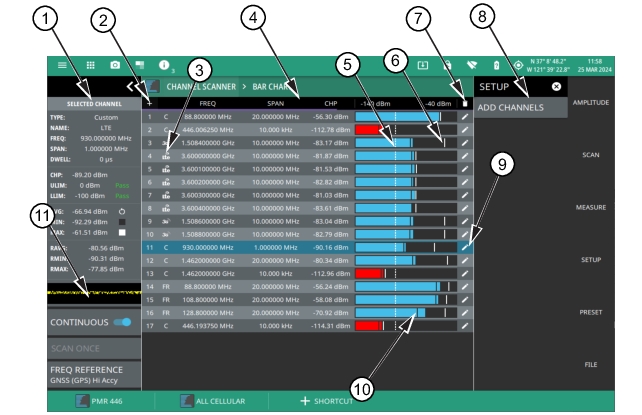
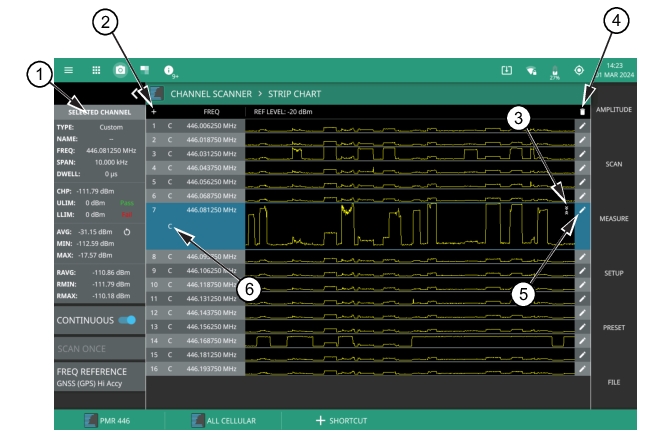
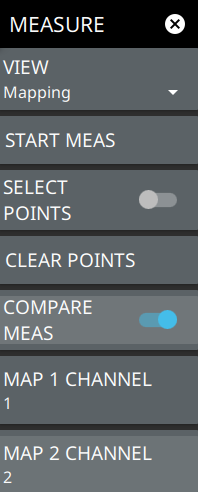
VIEW
Selects the measurement view as either bar chart or strip chart.
Bar Chart: This view displays the list of channel (s) represented in horizontal bars. Each channel is represented with unique setup parameters such as frequency, span, channel power and reference level. See Bar Chart
Strip Chart: This view displays the list of channel (s) represented in horizontal strips. Each channel is represented with unique setup parameters such as frequency and reference level. See Bar Chart.
Mapping: This view displays signal strength mapping on the instrument display and will plot color-coded signal values at GNSS (GPS) coordinates of channel power measurement. See Mapping.
START MEAS
Initiates a coverage mapping measurement. A valid GNSS antenna must be connected to the instrument and enabled for recording measurement data.
SELECT POINTS
Selects the measurement points on the map.
CLEAR POINTS
Clears all measurement points from the map.
COMPARE MEAS
Splits the mapping view window into two equal parts, when turned on. Displays a single map of the selected channel, when turned off.
MAP 1 CHANNEL 1
Indicates the map 1 of the selected channel, on the left.
MAP 2 CHANNEL 2
Indicates the map 2 of the selected channel, on the right.
 
Bar Chart
Select bar chart view from MEASURE > VIEW > Bar Chart. Or press on the active view on top of the screen to make appropriate selection.
Channel Scanner Bar Chart View
1. Status Panel provides a quick access to common settings used for power meter measurements. Refer to Status Panel (Bar Chart).
2. Plus icon adds channels. You can also add channels by pressing SETUP > ADD CHANNELS.
3. Technology icon shows the mini icon of the selected frequency band.
4. Bar Chart View displays the list of channel indicated in horizontal bars. The channel parameters such as frequency, span, channel power and reference level are included at the top of the bar chart view. The blue bar indicates that the channel power value is within the set upper or lower limit range. The red bar indicates that the channel power value exceeds the upper/lower limit range. Refer to Bar Chart.
5. The white dashed line is the limit line.
6. The solid white line on the horizontal bar is the maximum limit line that indicates maximum channel power value measured for any given channel.
7. Trash can icon deletes all the channels at once.
8. Setup Menu allows you to add channels. Refer to SETUP Menu.
9. Edit icon allows you edit the channel parameters. You can delete a single channel or apply any changes made to the listed parameters.
10. The solid black line is minimum limit line that represents the minimum channel power value measured for any given channel.
11. Strip Chart displays the strip chart view of the selected measurement channel. Refer to Strip Chart.
Strip Chart
Select strip chart view from MEASURE >VIEW > Strip Chart. The strip chart view illustrates the line graph of the given channel (s) added in a given frequency band or spectrum.
 
Channel Scanner Strip Chart View 
1. Status Panel provides quick access to common settings used for power meter measurements. Refer to Status Panel (Bar Chart).
2. Plus Icon acts like a quick shortcut to add channels.
3. Expand/Collapse icon allows to either expand or collapse the horizontal strip of a given channel.
4. Trash Can icon deletes all the channels.
5. Edit icon edits the channel parameters.
6. Technology Icon represents official frequency band or custom band name.
Mapping
To select channel scanner mapping view go to main menu and press MEASURE > VIEW > Mapping. The setup parameters used to make coverage mapping measurements are included in the SETUP Menu (Mapping View). The mapping view supports both outdoor and indoor coverage mapping.
The Coverage Mapping Option 431 provides signal strength mapping on the instrument display and will plot color-coded signal values at GNSS (GPS) coordinates for the following measurement:
Channel Power: The total power within the set channel bandwidth.
Note 
The Coverage Mapping option for outdoor signal mapping requires an active GNSS antenna to be connected to the instrument. Offline maps will need to be uploaded to the instrument if an Internet connection is not available. Refer to Map Tool section in spectrum analyzer measurement guide (PN:10580-00447). Indoor coverage mapping does not require a GNSS (GPS) antenna.
Once coverage mapping view is selected, start the mapping measurement via MEASURE > START MEAS.
Refer to Outdoor Coverage Mapping and Figure: Coverage Mapping (Outdoor) for an overview of outdoor coverage mapping and the user interface.
Refer to Indoor Coverage Mapping and Figure: Channel Scanner Indoor Mapping for an overview of indoor coverage mapping and the user interface.
Note that the coverage mapping setup menu is common to both map types.
 
Channel Scanner Mapping View
1. The coverage mapping status panel provides quick access to common settings and allows you to start and stop a coverage mapping measurement. A color-coded signal strength legend including the corresponding percentage values are also displayed. Refer to Status Panel (Bar Chart).
2. The map zoom tool allows you to increase (+) or decrease (-) the zoom level. You can also drag the zoom level indicator up or down, or you can pinch to change zoom level.
4. Re-centering tool centers the current GNSS (GPS) position on the map. The re-centering tool is only available if a GPS antenna is connected to the instrument.
5. Replay interval can be adjusted per need, minimum is 0.1 s and max is 10 s.
6. The forward button increments the position of the current measurement data point by 5 points.
7. The next button increments the position of the current measurement data point by 1 point.
8. The play/pause button plays or stops the route replay.
9. The reverse button decrements the position of the current measurement data point by 5 points.
10. The previous button the decrements the position of the current measurement data point by 1 point.
11. The selected point when pressed displays the keypad to enter the number of points. Minimum number of points is 1 and maximum is 661 points.
12. The link icon when selected links both map1 and map 2 coverage points, so you pan across the maps simultaneously.
13. The black circle represents the center of the total distance covered.
14. The data point icon displays all the color-coded data points of the GNSS (GPS) map coverage.
15. Route replay tab is used to replay the The reverse button selects the data point 5 points behind the current position of the active data point.hannel coverage mapping between the start and destination points. You can rewind, forward, pause the replay, etc.