 |
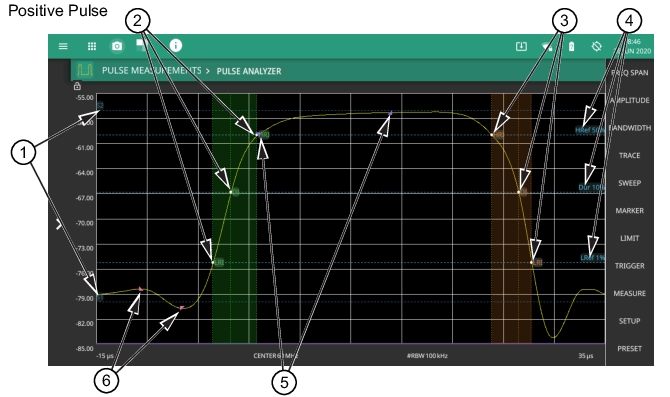
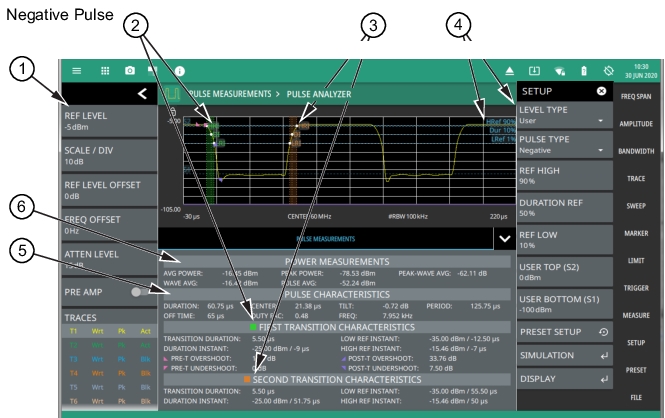
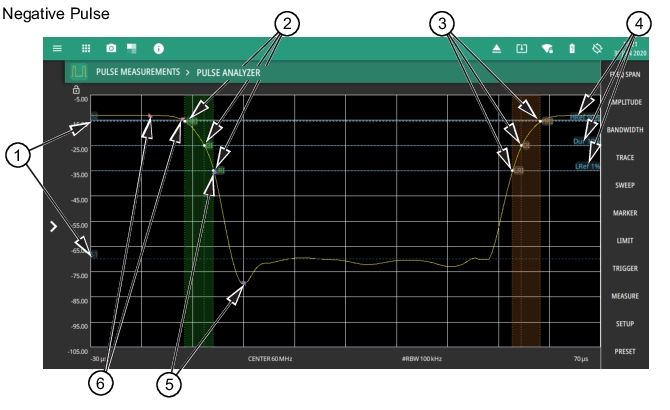
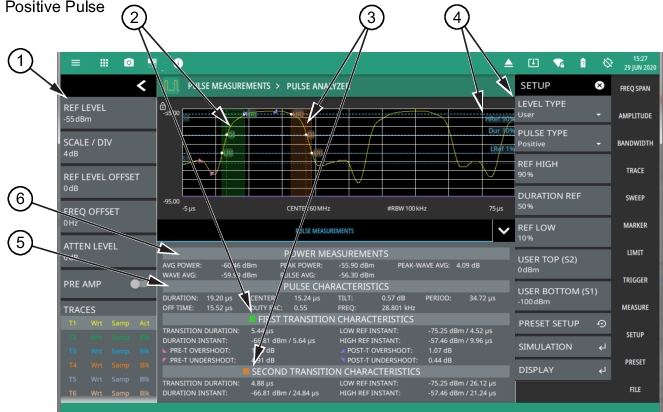
1. Status Panel: The pulse analyzer shares the spectrum analyzer status panel, displaying general settings for the current measurement. Refer to Status Panel. 2. First Transition Measurement Characteristics: The first pulse transition is shown in a green shaded area with measurement points and labels displayed on the currently selected trace and measurement data in the corresponding summary table. 3. Second Transition Measurement Characteristics: The second pulse transition is shown in an orange shaded area with measurement points and labels displayed on the currently selected trace and measurement data in the corresponding summary table. 4. Reference Level Lines: Reference levels are shown as dashed blue lines with labels that correspond to their configuration buttons in the SETUP menu. 5. Pulse Characteristics: This data shows the overall pulse measurements. 6. Power Measurements: This data shows the signal power measurements. |