 | |
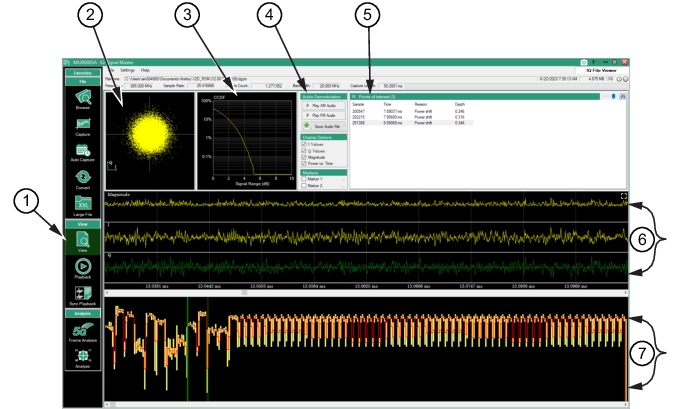
1. View Menu: The View menu button. 2. IQ Constellation Diagram: The constellation diagram shows I/Q value pairs in the raw data file. As raw data, the location of the points depends on the sample rate and may appear more random than normal. In this display the modulation scheme is not known and no processing is taking place to display symbol points. Use the Analysis menu as described in Analysis Mode to specify modulation details and extract the more familiar constellation diagram at symbol points. 3. CCDF Plot: (Complementary Cumulative Distribution Function) The x-axis represents the power level above the average power and the y-axis represents the percentage of time the signal power is at or above the power represented at the x-axis. 4. Audio Demodulation/Display Options/Markers Panel: See Table: Audio Demodulation, Table: Display Options, and Table: Markers. 6. IQ Data Displayed in Time: The Magnitude, I, and Q data display. Use the Scroll bar below the Q display to scan the data in the time spectrum. 7. Power Vs. Time Data: Displays the power vs. time. Use the Scroll bar below the Power vs. Time display to scan the data. |