 |
|
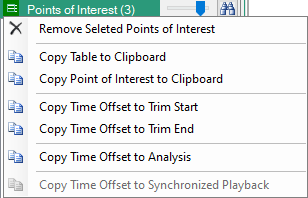
3-bar Icon Press to provide the content menu shown in Figure: Points of Interest Window. Right-click the Points of Interest table provides the same context menu. Remove Selected Points of Interest Click one or multiple points from the Points of Interest table and click Remove Selected Points of Interest to delete them from the table. Copy Table to Clipboard Copies the entire Points of Interest table into the clipboard. Copy Point of Interest to Clipboard Copies a selected Point of Interest from the table into the clipboard. Copy Time Offset to Start Copy the time offset value of the selected Point of Interest into the Convert menu Start (ms) field. See Trim Adjust Window. Copy Time Offset to End Copy the time offset value of the selected Point of Interest into the Convert menu Stop (ms) field. See Trim Adjust Window. Copy Time Offset to Analysis Copy Time Offset value to the Analysis Menu. Copy Time Offset to Synchronized Playback Copy the Time Offset value into the Synchronized Playback Menu Playback Offset field for that file. | |
Sensitivity Slider Slide left provides a less sensitivity search where the bandwidth search is large and will result in the most significant signal changes. Slide right provides a more sensitive search where the bandwidth search is smaller and will result in capturing more signal point changes, but some changes may be less detectable when viewed on the graph display. | |
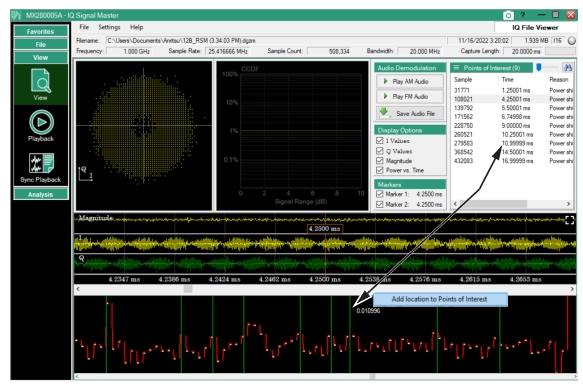
Find Icon Press to search for the Points of Interest of the I,Q, and M signal display. As points of interest are located, the signals parameters are logged as shown in Figure: Points of Interest Window. The field updates each time the resolution slider is moved to increase or decrease resolution, | |
Sample Location of the POI. The sample number at which the signal change occurs. Time (µs) Time of the occurrence. (Sample / sample rate) Reason Type of signal change flagged as a POI. (Power shift or Modulation shift) Depth A dimensionless measure of how much the modulation or power has shifted. It is useful when comparing between entries in the table. You can sort on each column by clicking the column title. So ‘Depth’ is in the table so you can sort and see the points that had the largest power or modulation shift at the top of the list. |
 |
 |