 | Markers 1 Click Marker 1 to jump to marker 1 location in the I/Q data plot. Markers 2 Click Marker 2 to jump to marker 2 location in the I/Q data plot. See Marker Position.. |
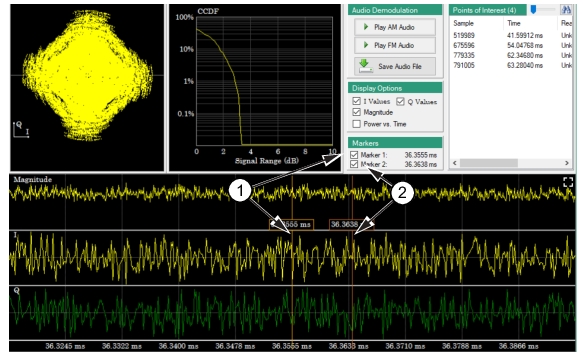 |
1. Marker 1: Shift-click puts a time marker 1 on the screen where the mouse is positioned. 2. Marker 2: Control-click puts a time marker 2 on the screen where the mouse is positioned. |