 |
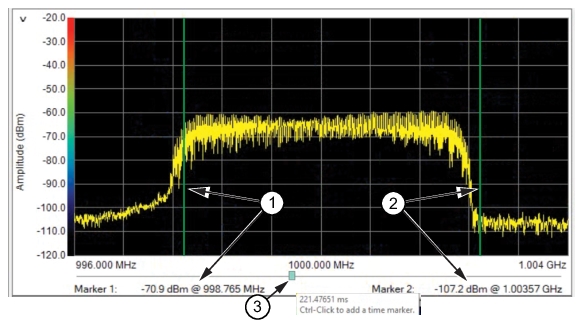
1. Marker 1: Position the mouse over a frequency region of interest in the frequency graph and perform a shift-click to set Marker 1 on that frequency on the graph. See Set Time Markers. 2. Marker 2: Position the mouse over a second frequency region of interest and perform a control-click to set Marker 2 on that frequency on the graph. See Set Time Markers. 3. Time Slider: Indicates the time position within the time spectrum of the sweep. The slider moves as the frequency sweep is performed. The slider can be repositioned manually to perform analysis of a specific bandwidth. |