Note | The playback menu is disabled if IQ File Playback option is not enabled. |
![]() | |
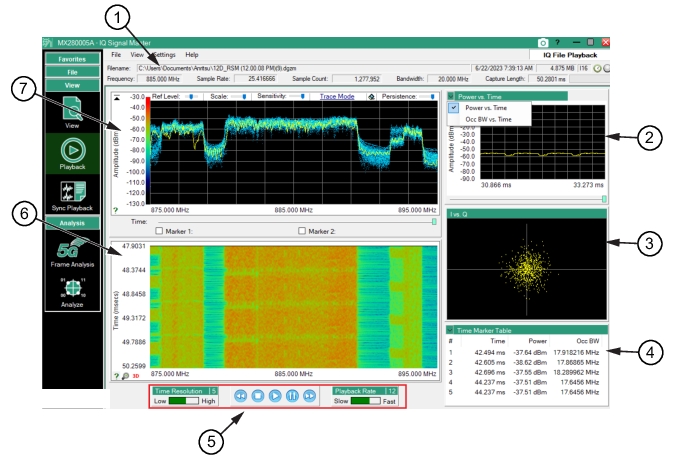
2. Power vs. Time Graph: Displays power vs time. 3. IQ Constellation Plot: Plots the raw I/Q value pairs from the data file used to generate each frequency plot. This is raw I/Q data and will not align with the symbol points in a more familiar constellation diagram. 4. Peak Table (Shown): Captures Points of Interest. This table also can be changed to AM Audio, FM Audio, Time Marker Table. 6. Spectrogram Window: The display area shows spectrogram trace data in the time (vertical axis), frequency (horizontal axis), and amplitude (color) domains. 7. Spectrum Window: Spectrum trace data in the frequency domain. |
- ![]() | Load IQ Data File Browse to find and load an IQ file Recent IQ Files Open to display the recent IQ files that have been viewed. Basic information is stored and subsequently when the same file is opened again it is very fast. Along with the basic file description, user settings such as markers are also stored in the same place. Recent Captured Files Open to display the recently captured IQ files. This command minimizes the need to browse the file folders to search for the recently captured and saved IQ files. Reload IQ Data Reload the most recent viewed file. Exit: Exits the program. |
![]() | Power vs. Time Click to change the top right graph to Power vs. Time. A check mark indicates active. Occupied BW vs. Time Click to change the top right graph to Occupied Bandwidth. A check mark indicates active. |