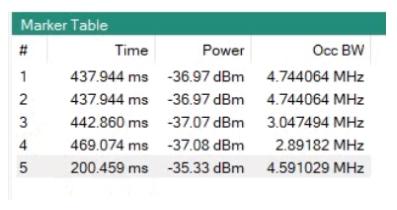
The Marker Table records the signals Time, Power, and Occupied Bandwidth of a user’s point of interest as shown in
Figure: Marker Table. The points of interest that have been marked and recorded in the marker table can be selected for analysis by clicking a line of data in the marker table to display the saved signal on the spectrogram and frequency graph.