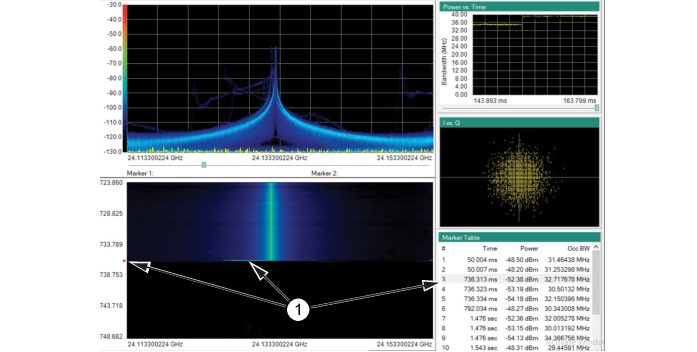
When points of interest are logged in the Maker Table, each can be analyzed in detail. An example of a signal being analyzed is shown in Figure: Analyzing a Points of Interest. Double-clicking a point of interest will display one screen length of information in the spectrogram graph. In this example, marker #3 is double-clicked. By default, the spectrogram screen scrolls upward for one screen length and stops with the point of interest centered in the spectrogram display. The red arrowhead on the left of the screen points to the time marked in the marker table for marker #3 where the points of interest was captured. The spectrogram shows a frequency glitch that occurred at the end of the trace. This glitch can then be analyzed closer as shown in Figure: Increase Time Resolution.
Analyzing a Points of Interest
1. Point of Interest #3
2. Time Resolution
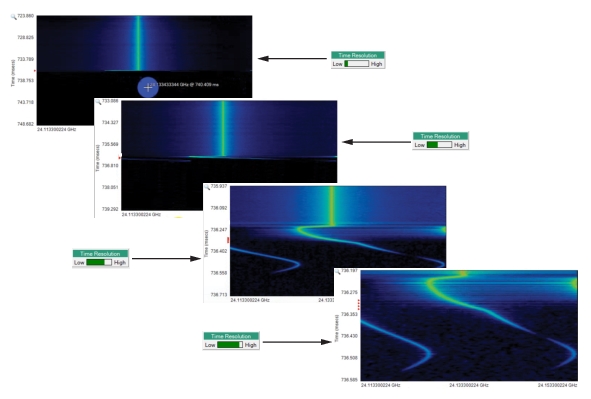
Increase Time Resolution
Increasing and the time resolution in the spectrogram is accomplished in two ways. To increase the time resolution in the spectrogram:
1. Manually move the Time Resolution the bar towards the right.
2. Hover the mouse over the spectrogram close to the point of interest and double-click. The Time Resolution bar will also increase at each double-click.