 |
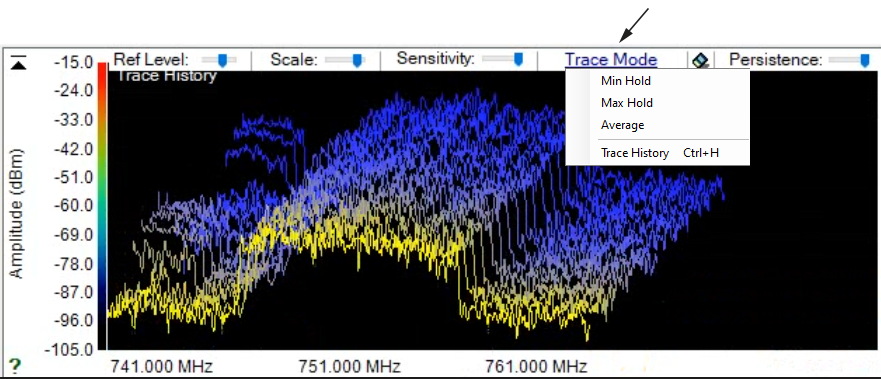
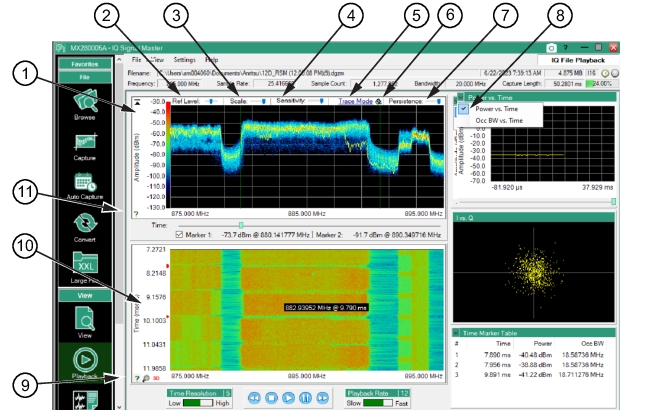
1. Trace Density Plot: Displays the IQ data stream. Use the tools in this window for signal analyses 2. Reference Level Slider: Use the slider to increase or decrease the Amplitude resolution of the frequency/amplitude display. Changes are shown in the amplitude scale as the slider is moved. 3. Scale Slider: Use the slider to increase or decrease the Scale (dBm/Division) resolution. 4. Sensitivity: Use the slider to adjust the sensitivity of the density plot display. 5. Trace Mode: Press to show the Trace Mode menu shown below. Click Max Hold, Min Hold, Average, or Trace History for the density plot. Trace History is described in Trace History. 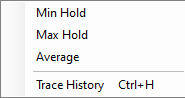 6. Clear Density Plot: Press to clear the density plot graph. 7. Persistence Slider: Use the slider to increase or decrease the persistence level (how long traces are displayed) in the density plot. 8. Graph Display Toggle: Set the graph display as Occupied Bandwidth vs. Time or Power vs. Time 9. Spectrogram Information Icon: Hover over the spectrogram information icon to show the dialog shown. 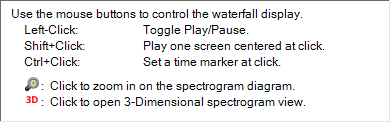 10. Spectrogram Window: Displays the Spectrogram View. Red time-markers on the left edge display the data markers in the Time Marker Table. The tool tip readout is the mouse position on spectrogram that provides the frequency and time resolution of the mouse at that location on the spectrogram display. 11. Trace/Density Information Icon: Hover over the trace/density information icon to show the dialog shown. 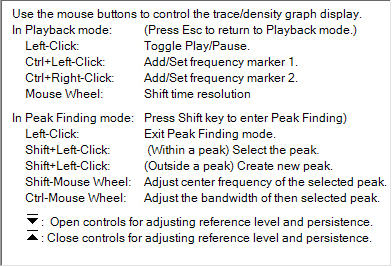 |