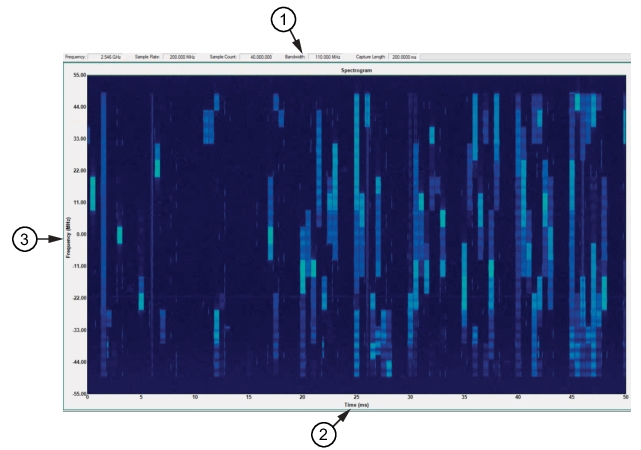
The 5G spectrogram view below provides a graphical display with the horizontal axis in time and the vertical axis is in frequency. The frequency is centered at 0 MHz so that the 110 MHz frequency bandwidth, shown in the parameters panel, is covered with 55 MHz on each side of the centered 0 MHz frequency.
5G Spectrogram View
1. Data Bandwidth
2. Time Axis
3. Frequency Axis
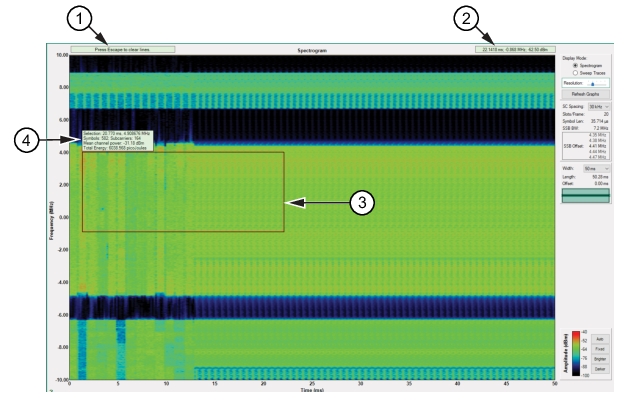
Cursor Control
Moving the cursor over the spectrogram provides a set of cross-hairs that identify the cursor position as a readout in time, frequency, and power level. Left-click for the SSB cursor position. Shift right-click and drag the cursor to draw a block over an area as shown in Figure: Obtain IQ Data Details. The details of the area enclosed is shown in a readout as shown in Figure: Red-Bordered IQ File Details. Press the keyboard Esc key to reset to the cursor readout.
Obtain IQ Data Details
1. Press Keyboard Escape to clear lines
2. Cursor location readout
3. Expanded red rectangle lines
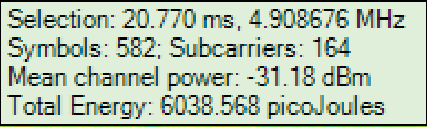
4. Red rectangle area readout
The details provide specific data parameters of the area captured.