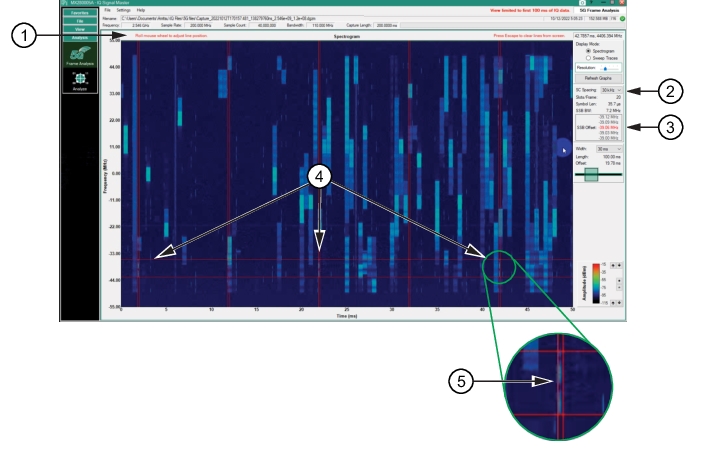
2. Set the SC Spacing (this example is set to 30 kHz).
3. Click the spectrogram graph to display the SSB grid. The double grid lines display the width and height of the SSB.
4. Scan the spectrogram until the SSBs are identified as they align in the time intervals (20 ms) as shown. Once the SSB has been located, roll the mouse to optimize the SSB alignment between the SC spacing grid lines. This is the SSB as indicated in the red font of the SSB offset window.