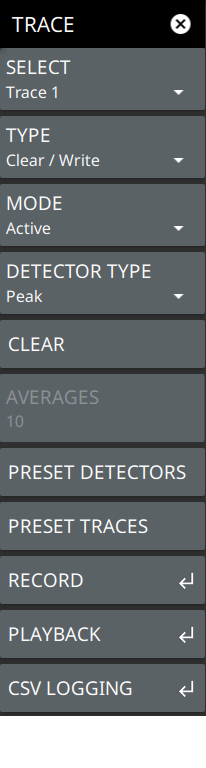
 | SELECT Selects traces 1 through 6. Selecting a trace that is off turns the trace on. The trace type will be Clear/Write, the trace mode will be Active, and the detector type will be Peak. Selecting a trace will draw the trace on top of all other traces. This feature is not available in the spectrogram measurement view because all spectrogram data is created from a single trace. TYPE Selects one of the following types of traces: • Clear/Write: Clears the trace after each sweep is complete and writes a new trace. • Average: The exponential average of all N traces, where N is the AVERAGES number set below. The number of sweeps is displayed in the status panel TRACES table. • Max Hold: Represents the maximum value since sweeping began. The number of sweeps is displayed in the status panel TRACES table. • Min Hold: Represents the minimum value since sweeping began. The number of sweeps is displayed in the status panel TRACES table. • Rolling Average: Is the rolling average of the last N traces, where N is the AVERAGES number set below. The number of sweeps is displayed in the status panel TRACES table. • Rolling Max Hold: Is the maximum rolling average value of the last N traces, where N is the AVERAGES number set below. The number of sweeps is displayed in the status panel TRACES table. • Rolling Min Hold: Is the minimum value of the last N traces, where N is the AVERAGES number set below. The number of sweeps is displayed in the status panel TRACES table. TRACE MODE Selects one of the following trace modes: • Active: Displays the selected trace as it is updating. • Hold/View: Displays the trace and it is not updating. It displays the last sweep from when the trace mode was set to hold/view. If the frequency or bandwidth settings are changed while a trace is in hold/view mode, the data will be blanked from the screen. In order to see data again, set the trace mode to active. • Blank: Does not display the trace and is not updating. It is the same as if the trace was off. |
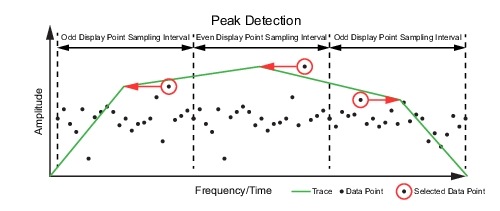
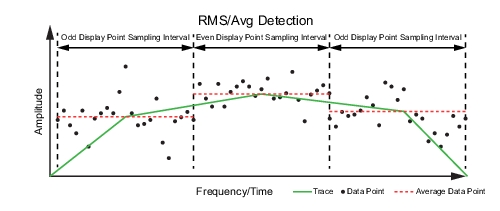
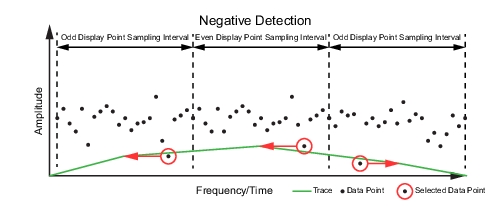
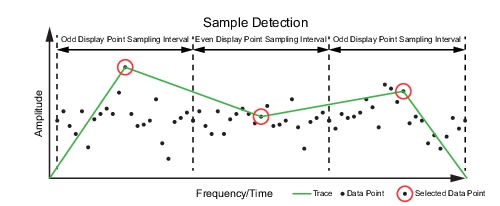
DETECTOR TYPE Selects one of three detector types. Several detection methods tailor the function of the instrument to meet specific measurement requirements. There are often more measurement points across the screen than display points. The various detection methods are different ways of dealing with how measurement points will be shown at each display point. • Peak: This method causes the highest amplitude measurement point to be shown for each display point, assuring that a narrow peak is not missed. • RMS/Avg: In the default case, when the VBW/AVERAGE type is set to Linear, this method detects the average power of measurement points that go into the display point. When VBW/AVERAGE type is set to Log, the traditional average of log (power), such as dBm, is displayed for the detector, as well as for VBW and trace average. • Negative: This method causes the lowest amplitude measurement point to be shown for each display point. This method is also useful when looking at modulated signals, to see if some frequencies are not being used. • Sample: Shows the transient amplitude of the center of sampled data for each display point. This method is useful when measuring low-level signals and noise measurements. Only available in zero span and RSSI measurements. When Sample detector is selected, all traces must use sample detection. CLEAR Clears the currently active trace data. AVERAGES Sets the number of trace sweeps (N) to average. Available when the trace type is set to one of the averaging modes. PRESET DETECTORS Sets all trace detectors to Peak. PRESET TRACES Presets cursor and trace setup to Clear/Write, Active, with Peak Detector. |