Field Master Series can display up to 6 traces simultaneously. Traces can be enabled from the TRACE menu by selecting the trace from the available selections, or you can select a trace in the Status panel to make it active. Each trace can have a separate trace type, mode, and detector. When working with traces in RF Spectrum view, refer to TRACE Menu (RF Spectrum View).
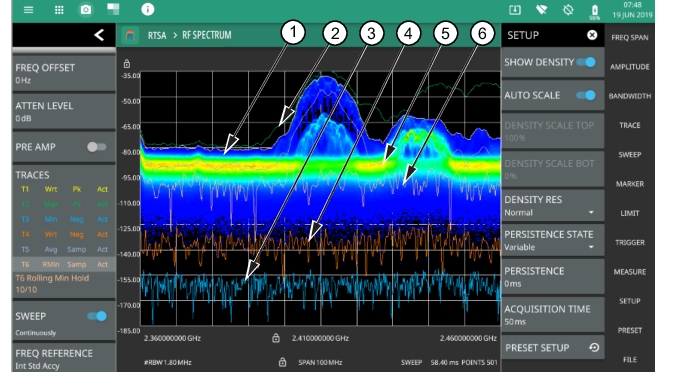
The screenshot below shows the real-time spectrum analyzer with all six traces enabled on a signal, each with a different trace or detector type setting. The left side status panel shows a trace setup summary table. Touching one of the trace rows in the table will enable the trace and open the TRACE menu.
Traces in Spectrum View
1. Clear/Write and Peak Detection: This is the default trace setting. The trace is cleared during each sweep and the largest measurement point is used for each display point.
2. Max Hold and Peak Detection: Each trace point retains its maximum value and the largest measurement point is used for each display point.
3. Min Hold and Negative Detection: Each trace point retains its minimum value and the smallest measurement point is used for each display point.
4. Clear/Write and Negative Detection: Trace points are cleared during each sweep and the smallest measurement point is used for each display point.
5. Average and Sample Detection: The trace points are an average of the previous N sweeps, where N is the AVERAGES setting. Sample detection uses the median measurement point.
6. Rolling Min Hold and Sample Detection: The trace points are the minimum of the average of the previous N sweeps, where N is the AVERAGES setting. Sample detection uses the median measurement point.
7. T1-T2 or T2-T1: Appears only when Trace 5 or 6 are enabled. When selected displays the difference between T1 and T2, in addition to the second Y axis on the right hand side.
TRACE Menu (RF Spectrum View)
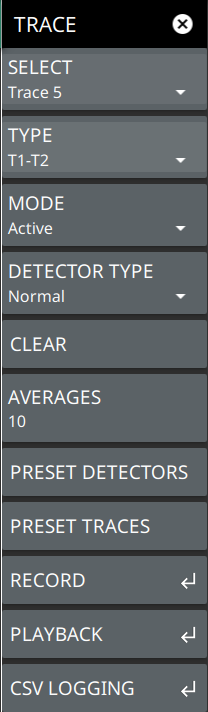
TRACE Menu
SELECT
Selects traces 1 through 6. Selecting a trace that is off turns the trace on. The trace type will be Clear/Write, the trace mode will be Active, and the detector type will be Peak. Selecting a trace will draw the trace on top of all other traces. This feature is not available in the spectrogram measurement view because all spectrogram data is created from a single trace.
TYPE
Selects one of the following types of traces:
• Clear/Write: Clears the trace after each sweep is complete and writes a new trace.
• Min Hold: Represents the minimum value since sweeping began. The number of sweeps is displayed in the status panel TRACES table.
• Max Hold: Represents the maximum value since sweeping began. The number of sweeps is displayed in the status panel TRACES table.
• Average: The exponential average of all N traces, where N is the AVERAGES number set below. The number of sweeps is displayed in the status panel TRACES table.
• Rolling Max Hold: Is the maximum rolling average value of the last N traces, where N is the AVERAGES number set below. The number of sweeps is displayed in the status panel TRACES table.
• Rolling Min Hold: Is the minimum value of the last N traces, where N is the AVERAGES number set below. The number of sweeps is displayed in the status panel TRACES table.
• Rolling Average: Is the rolling average of the last N traces, where N is the AVERAGES number set below. The number of sweeps is displayed in the status panel TRACES table.
• T1-T2: This option appears only when Trace 5 is enabled.
• T2-T1: This option appears only when Trace 6 is enabled.
In trace math the T2-T1 or T1-T2 operation performs a division of the linear powers (Watts) of trace 2 divided by trace 1 and vice versa, this is equivalent to the subtraction of the log powers (dBm). The operation does not change depending on the amplitude units and the resulting math trace is always in dB. When a math trace enabled, a secondary Y axis appears on the right side of the trace window. Most measurements are incompatible with dB values and will stop updating when a math trace is the active trace. Limit lines on math traces interpret their values as (dB).
MODE
Selects one of the following trace modes:
• Active: Displays the selected trace as it is updating.
• Hold/View: Displays the trace and it is not updating. It displays the last sweep from when the trace mode was set to hold/view. If the frequency or bandwidth settings are changed while a trace is in hold/view mode, the data will be blanked from the screen. In order to see data again, set the trace mode to active.
• Blank: Does not display the trace and is not updating. It is the same as if the trace was off.
DETECTOR TYPE
Selects one of the available detector types. Several detection methods tailor the function of the instrument to meet specific measurement requirements. There are often more measurement points across the screen than display points. The various detection methods are different ways of showing each display point (see Trace Detector Types).
• Peak: Shows the maximum amplitude of sampled data for each display point, assuring that a narrow peak is not missed.
• Negative: Shows the minimum amplitude of sampled data for each display point. This method is also useful when measuring modulated signals to see if some frequencies are not being used.
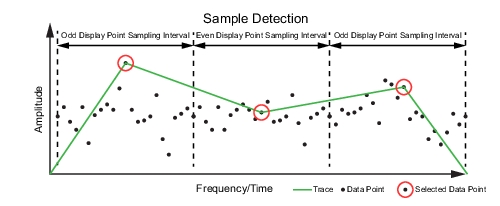
• Sample: Shows the transient amplitude of the center of sampled data for each display point. This method is useful when measuring low-level signals and noise measurements.
• Normal: Shows random noise and signal data depending on the nature of the sampled data. If the signal both rises and falls during the sampling interval (random noise), then odd-numbered sampling intervals display the maximum value and even-numbered sampling intervals display the minimum value. Odd-numbered sampling intervals will display the peak value of the previous even-numbered sampling interval when the peak there is higher. If the signal only rises or only falls during the sampling interval (signal), then only the peak value is displayed, and Normal detection is then equivalent to Peak detection.
CLEAR
Clears the currently active trace data.
AVERAGES
Sets the number of trace sweeps (N) to average. Available when the trace type is set to one of the averaging modes.
PRESET DETECTORS
Sets all trace detectors to Peak.
PRESET TRACES
Presets trace setup to Clear/Write, Active, with Peak Detector.
The figures below illustrate how the selected detector type determine a trace data point from the sampled data.
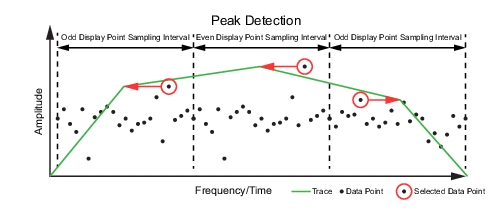
Peak
Shows the maximum amplitude of sampled data for each display point, assuring that a narrow peak is not missed.
Peak Detector Type
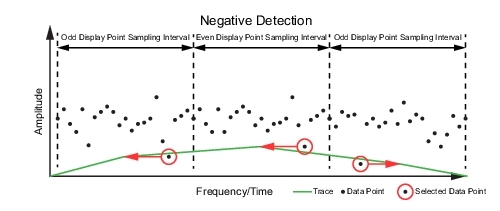
Negative
Shows the minimum amplitude of sampled data for each display point. This method is also useful when measuring modulated signals to see if some frequencies are not being used.
Negative Detector Type
Sample
Shows the transient amplitude of the center of sampled data for each display point. This method is useful when measuring low-level signals and noise measurements. Only available in zero span and RSSI measurements.
Sample Detector Type
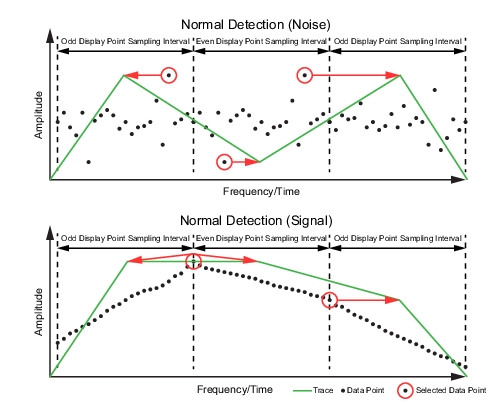
Normal
Shows random noise and signal data depending on the nature of the sampled data. If the signal both rises and falls during the sampling interval (random noise), then odd-numbered sampling intervals display the maximum value and even-numbered sampling intervals display the minimum value. Odd-numbered sampling intervals will display the peak value of the previous even-numbered sampling interval when the peak there is higher. If the signal only rises or only falls during the sampling interval (signal), then only the peak value is displayed, and Normal detection is then equivalent to Peak detection.
Normal Detector Type
Cursors in Spectrogram View
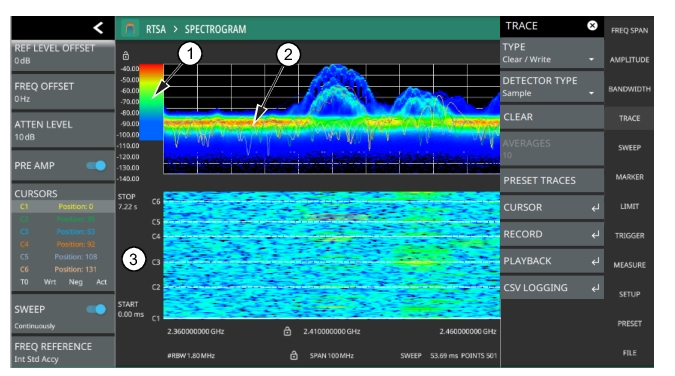
The screenshot below shows the Real-time spectrum Analyzer with all six cursors enabled on a signal. Cursors are shown on the spectrogram as white lines. The active cursor is a solid white line and other cursors show as dashed white lines. Cursors can be directly selected and dragged to position on the display or set via the TRACE > CURSOR menu. Cursors and their settings can also be accessed via the left side status panel by touching a cursor in the CURSORS table. The START time is the most recently completed sweep and the beginning of the spectrogram display. The STOP time is the total time length of the spectrogram, essentially the amount of time it takes for all completed sweeps to progress from the bottom to the top of the spectrogram window. The stop time will vary depending on the sweep speed, which can be faster or slower depending on settings such as span and RBW.
RTSA – Spectrogram View
1. Color Bar settings are used to adjust the colors displayed at different amplitude levels. The color bar shown here represents the range of colors that will be displayed. This bar can be dragged up or down to adjust the coverage area. If signals or noise is outside of the color bar range, then black is displayed. The color bar top and bottom setting, and the overall hue to the color range is set via the SETUP Menu (RF Spectrum View).
2. The traces shown in Spectrogram view are updated when the data in the spectrogram lands on the associated cursor. The traces show sweep data from that respective point in time. The bandwidth and amplitude settings in the example above were changed. Traces 1 through 3 reflect the changed settings while traces 4 through 6 are showing sweep data from earlier points in time. To freeze the spectrogram, stop the instrument from sweeping by toggling off Sweep Continuously.
3. The spectrogram START and STOP times shown here represent the full duration of all 142 sweeps shown in the spectrogram window. Cursors 1 through 6 are positioned throughout the spectrogram and can be dragged or set to a new time or position using the TRACE CURSOR Menu. Cursors can also be selected via the left side status menu CURSORS table. The bottom of the table shows the reference trace (T0) and its settings. The reference trace setting apply to all traces shown in the spectrum display.
TRACE Menu (Spectrogram View)
When the combined Spectrogram view is selected (MEASURE > VIEW > SPECTROGRAM), the TRACE and SETUP menus are updated with spectrogram and cursor setup controls.
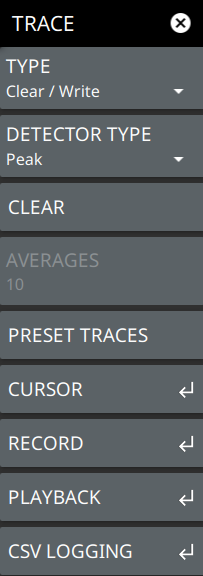
TRACE Menu
TYPE
Selects one of the following types of traces:
• Clear/Write: Clears the trace after each sweep is complete and writes a new trace.
• Min Hold: Represents the minimum value since sweeping began. The number of sweeps is displayed in the status panel TRACES table.
• Max Hold: Represents the maximum value since sweeping began. The number of sweeps is displayed in the status panel TRACES table.
• Average: The exponential average of all N traces, where N is the AVERAGES number set below. The number of sweeps is displayed in the status panel TRACES table.
• Rolling Max Hold: Is the maximum rolling average value of the last N traces, where N is the AVERAGES number set below. The number of sweeps is displayed in the status panel TRACES table.
• Rolling Min Hold: Is the minimum value of the last N traces, where N is the AVERAGES number set below. The number of sweeps is displayed in the status panel TRACES table.
• Rolling Average: Is the rolling average of the last N traces, where N is the AVERAGES number set below. The number of sweeps is displayed in the status panel TRACES table.
DETECTOR TYPE
Selects one of the available detector types. Several detection methods tailor the function of the instrument to meet specific measurement requirements. There are often more measurement points across the screen than display points. The various detection methods are different ways of showing each display point (see Trace Detector Types).
• Peak: Shows the maximum amplitude of sampled data for each display point, assuring that a narrow peak is not missed.
• Negative: Shows the minimum amplitude of sampled data for each display point. This method is also useful when measuring modulated signals to see if some frequencies are not being used.
• Sample: Shows the transient amplitude of the center of sampled data for each display point. This method is useful when measuring low-level signals and noise measurements.
• Normal: Normal detector type also referred to as Rosenfell, shows the random noise than positive peak and avoids the missed-signal problem of the Sample Mode. Should the signal both rise and fall within the bucket interval, then the algorithm classifies the signal as noise. An odd-numbered data point displays the maximum value encountered during its bucket. An even-numbered data point displays the minimum value encountered during its bucket. If the signal is NOT classified as noise (does NOT rise and fall) then Normal is equivalent to positive peak.
CLEAR
Clears the currently active trace data.
AVERAGES
Sets the number of trace sweeps (N) to average. Available when the trace type is set to one of the averaging modes.
PRESET TRACES
Presets cursor and trace setup to Clear/Write, Active, with Peak Detector.
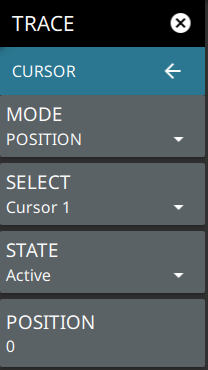
Every trace captured in the spectrogram has a time and a position index. Set the location of the spectrogram cursor based on either the time index or the position index. When position is selected, you can change the position index of the cursor from the POSITION button. If Time is selected, you can set the time index of the cursor from the TIME button. See the descriptions of POSITION and TIME below.
SELECT
Used to add up to six cursors or to set the active cursor on the spectrogram. The active cursor also displays the associated trace on top of other traces in the spectrum display. For more information, refer to Spectrogram with Cursors and Markers.
STATE
Selects one of the following cursor states:
• Active: Displays the selected trace as it is updating.
• Hold/View: Displays the trace and it is not updating. It displays the last sweep from when the trace mode was set to hold/view. If the frequency or bandwidth settings are changed while a trace is in hold/view mode, the data will be blanked from the screen. In order to see data again, set the trace mode to active.
• Blank: Does not display the trace and is not updating. It is the same as if the trace was off.
POSITION
Available when a position cursor is selected. You can change the sweep position index of the selected spectrogram cursor in relation to the number of total sweeps in the spectrogram. The number of sweeps in the spectrogram is based on the size of the spectrogram window, so the sweep index changes when changing the spectrogram cursor position index. The spectrum view also displays the currently selected trace on top of any other traces. A position of 0 (zero) represents the most recent (or live) trace. Entry into this field is disabled when the spectrogram cursor mode is set to Time.
TIME
Available when a time cursor is selected. You can change the time index of the selected spectrogram cursor in relation to the start and stop time displayed in the spectrogram. The time in the spectrogram is based on the size of the spectrogram window, so the time changes when changing the spectrogram cursor time index. The spectrum view also displays the currently selected trace on top of other traces. A time of 0 (zero) represents the most recent (or live) trace. Entry into this field is disabled when the spectrogram cursor mode is set to Position.
Trace Recording, Playback, and CSV Logging
The real-time spectrum analyzer supports recording and playing back of trace data. Recordings are actually made on sample data (not just trace points) so during playback, users can set different trace types or detectors for deeper analysis of the data. Trace recording and playback is accomplished by sequentially recording, then drawing, an entire trace through a recording session. In RTSA, only trace data is recorded (no density data). Recordings can be initiated on both the instrument or from the PC software when connected to an instrument. The files are saved as .fmrec on the instrument internal memory and must be played back on the instrument. The recorded file contains instrument setup information so it can be recalled from any mode and automatically configure the instrument settings for playback. The recorded trace data includes time and GPS information. If recording starts while the instrument is in spectrogram, recording starts with the next available sample and excludes all of the traces previously captured traces in the waterfall. During playback, the spectrogram is built from the replayed traces and an indication of the current trace count and total session trace count (i.e., 33/85) is shown at the right side of the trace display. This count increments during trace playback.
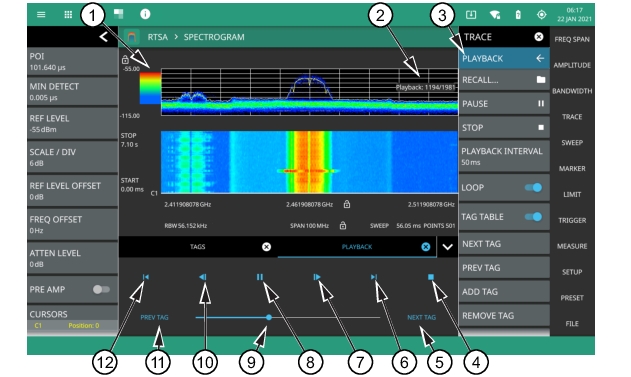
Figure: Trace – Record and Playback shows a recorded trace session during playback. When the playback menu is opened, playback controls are shown at the bottom of the screen.
Trace – Record and Playback
1. Recorded trace and spectrum waterfall.
2. Shows either the Recording or Playback indicator.
4. Stops the current trace playback session and restores live data display from the RF input.
5. Steps to the next tagged trace in the recorded session. Untagged traces will be skipped.
6. Increments the trace index by 142 to the next set of spectrogram traces.
7. Increments the trace index by 1 to the next trace in the sequence.
8. Starts playback of the selected trace recording. During playback, the button changes to the PAUSE button, allowing pausing of the playback.
9. Playback location indicator/slider - can be used to drag playback forward and backward.
10. Decrements the trace index by 1 to the previous trace in the sequence.
11. Steps to the previous tagged trace in the recorded session. Untagged traces will be skipped.
12. Decrements the trace index by 142 to the previous set of spectrogram traces.
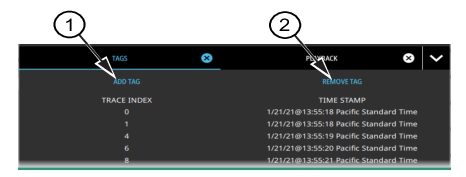
Tags are associated with individual traces, allowing scrolling through a sequence of tags and skipping forward or backward past untagged traces. All tagged traces can be viewed in a TAGS table (Figure: Tags Table), similar to a marker table. Users can add or remove tags from traces. To know which tag is being removed, look at the trace index in the display panel and correlate it to the trace index in the tag table.
Tags Table
1. Add tag button.
2. Remove tag button.
Other features with trace recording and playback:
• If settings that would invalidate the record or playback state are changed (i.e., frequency and amplitude settings, or changing analyzer modes), the current recording/playback session will end and the current recording will be saved.
• Markers and limits can be enabled on playback traces, just as with live data.
• Measurements such as channel power, OBW, ACP, or interference finder can be enabled on playback traces; all other measurements are blocked.
• New recordings can be made during playback to capture smaller segments of the previous recording.
• To save a .fmspa or .fmrtsa file at any point, it must be done in playback and while paused.
CSV Logging
CSV logging provides much of the same functionality as trace recording described above, but a CSV log cannot be replayed. CSV logging allows continuous recording of either live trace data or playback trace data to a CSV file with frequency and amplitude information for all traces captured during the logging period. When the log recording is stopped, a csv file is automatically created and saved. CSV logging can also be set to automatically record a recording or playback session. When AUTO LOG is set to either Record or Playback, a CSV log is simultaneously recorded with the record or playback session. When the session is paused, CSV logging is paused. When the session is stopped, CSV logging is stopped and saved.
CSV file format:
Header then trace data horizontally with time and GPS stamps. The header includes:
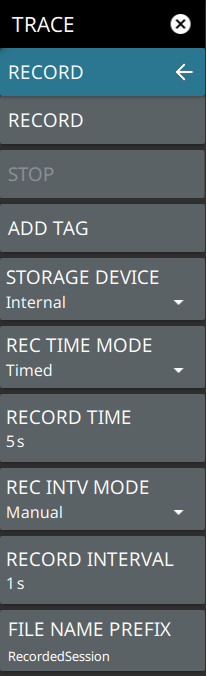
The trace recording feature is accessed via the TRACE > RECORD menus. This feature allows you to record a trace for future playback on the instrument or PC application.
TRACE – RECORD Menu
RECORD
Starts a trace recording session and saves traces and setup data to a record file (.fmrec). Files will be saved to the “Playback” folder on the selected storage device (below). When recording is initiated, this button changes to PAUSE so you can temporarily stop the recording while leaving the recording session open.
STOP
Stops the active trace recording session. When pressed, a dialog will ask to either keep or discard the recording data.
ADD TAG
Tags the currently recorded trace. This marks the trace for easy searching in the playback tag table. Tags can be added during recording, when the recording is paused, and during playback.
STORAGE DEVICE
Selects the target location for the trace recording. This will be to internal storage or to a connected external USB storage device.
REC TIME MODE
Sets the recording time mode to Auto or Timed. Automatic recording continues until the STOP button is pressed or until memory is full. Manual recording uses a set RECORD TIME. The recording session ends after that time is complete or the stop button is pressed, whichever comes first.
RECORD TIME
Sets the recording time session when the record time mode is set to manual.
REC INTV MODE
Sets the time interval mode (time between recording a trace) to automatic or manual. Automatic will record every trace the analyzer captures. Manual will record one trace every x seconds, where x is the RECORD INTERVAL set below. If the interval time is lower than the sweep time, every trace will be recorded.
RECORD INTERVAL
Sets the recording time interval when the record interval mode is set to manual. Recording stops at the end of the record time or when manually stopped.
FILE NAME PREFIX
Adds a custom file name prefix to the record file (.fmrec). The default prefix is “RecordedSession” and will be appended with a date and time stamp, such as: “Traces_20201216T062419.135.fmrec.”
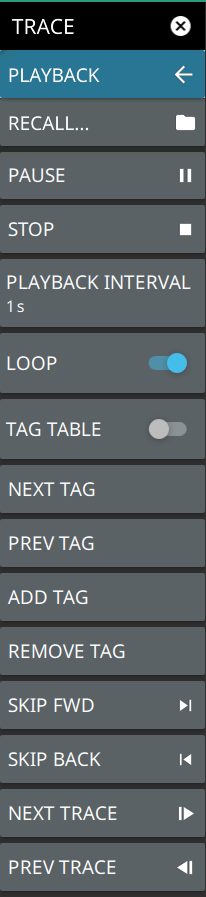
TRACE PLAYBACK Menu
The trace playback feature is accessed via the TRACE > PLAYBACK menus. This feature allows you to play back a recorded trace (.fmrec) file on the instrument or PC application.
TRACE – PLAYBACK Menu
A playback session must be started by first recalling a previously recorded session.
RECALL
Opens the file manager so you can select a recorded trace file for playback. The recorded files are typically stored in the Playback folder on the internal or external storage device. Once a trace is recalled, the instrument is set up to match the settings from when the trace was recorded and the PLAYBACK menu will need to be accessed to play the recalled file.
PLAY/PAUSE
Starts playback of the selected trace recording. During playback, the button changes to the PAUSE button, allowing pausing of the playback.
STOP
Stops the current trace playback session and restores live data display from the RF input.
PLAYBACK INTERVAL
Sets the trace playback interval. The playback interval is the sequential trace playback rate, which is the time a trace is displayed before sequencing to the next trace in the recording.
LOOP
When toggled on, the playback plays the trace samples in a loop until stopped. When toggled off, playback pauses at the end of the session. Press STOP to return to live traces or drag the slider back to the beginning and press PLAY to play the session again.
TAG TABLE
Toggles the tag table at the bottom of the screen.
NEXT TAG
Steps to the next tagged trace in the recorded session. Untagged traces will be skipped.
PREV TAG
Steps to the previous tagged trace in the recorded session. Untagged traces will be skipped.
ADD TAG
Adds a tag to the current trace. Tags are automatically saved to the file.
REMOVE TAG
Removes the tag from the current trace. Tags are automatically removed from the saved file.
SKIP FWD
Increments the trace index by 142 to the next set of spectrogram traces.
SKIP BACK
Decrements the trace index by 142 to the previous set of spectrogram traces.
NEXT TRACE
Increments the trace index by 1 to the next trace in the sequence.
PREV TRACE
Decrements the trace index by 1 to the previous trace in the sequence.
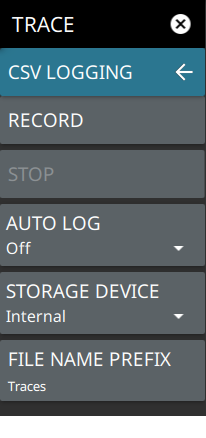
TRACE CSV LOGGING Menu
The trace CSV capture feature is accessed via the TRACE > CSV CAPTURE menus. This feature allows you to capture trace data in comma separated value (.csv) format.
TRACE – CSV LOGGING Menu
RECORD
Starts a recording session and saves trace and setup data to a CSV file (.csv). Files will be saved to the “PlaybackCsv” folder on the selected storage device (below). When recording is initiated, this button changes to PAUSE so you can temporarily stop the recording while leaving the recording session open.
STOP
Stops the active trace recording session. When pressed, a dialog will ask to either keep or discard the recording data.
AUTO LOG
Select one of the following automatic recording options (CSV recording will start automatically with Record or Playback selected – no need to press RECORD in the CSV menu. Manual CSV logging can be done independent of this setting.):
• Record: Simultaneously saves CSV log data during a trace recording.
• Playback: Simultaneously saves CSV log data during a recorded trace playback.
• Off: No auto logging selected.
STORAGE DEVICE
Selects the target location for the trace logging. This will be to internal storage or to a connected external USB storage device.FILE NAME PREFIX
Adds a custom file name prefix. The default prefix is “Traces” and will be appended with a date and time stamp, such as: “Traces_20201216T062419.135.csv.”