Refer to Making RTSA Measurements for basic information on setting up a spectrum measurement. This section provides setup information for making real-time spectrum measurements. The Field Master Series analyzer features smart measurements that make setup easy. The following sections present brief examples demonstrating the use of these measurements.
From the MEASURE menu, select one of the desired measurements.
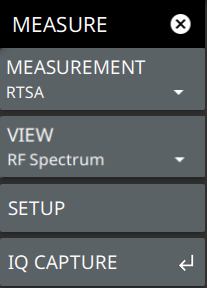
MEASURE Menu (RTSA)
MEASURE Menu
MEASUREMENT
Selects the desired measurement type from the following list:
• RTSA: Displays the frequency domain spectrum measurement.
• PIM/Interference: Available when Option 24 is installed. The input parameters and channel measurements tables, max/min level lines, and total channel power signal indicator are added to the measurement display. Refer to Interference Finder (Option 24).
VIEW
Selects the desired measurement view from the following list:
Refer to the IQ Capture/Streaming Measurement Guide for discussion of IQ Capture and Streaming, PN: 10580-00490.
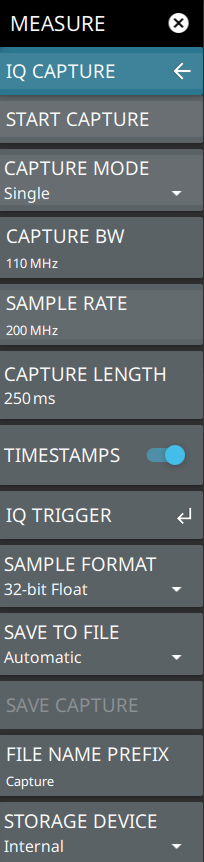
IQ CAPTURE Menu
IQ CAPTURE Menu
START/STOP CAPTURE
Touch this button to execute an IQ capture. When a capture is initiated, this button changes to STOP CAPTURE and can be touched to stop the continuous captures. Note that the captured data will still be saved unless the CANCEL SAVE button below is touched. Check the IQ status table at the bottom of the display.
CANCEL SAVE
This button appears after a capture has been initiated. Touch this button to present a dialog that allows you the choice to cancel the IQ capture save and discard the captured data, or to continue with the capture and save the data.
CAPTURE MODE
Selects the IQ capture mode:
• Single for a one-time capture to internal or external (USB) storage
• Continuous for capture to internal or external (USB) storage. Automatically initiates a new capture once the previous capture is saved.
• Streaming for continuous IQ data streaming out of the Ethernet, USB, or Data Out port (refer to IQ STREAMING Menu).
CAPTURE BW
IQ capture bandwidth is the frequency range of data to be collected for the duration of the IQ length. IQ capture bandwidth and sampling rate are linked and are selected from the same dialog.
SAMPLE RATE
Sets the IQ sampling rate of data to be collected for the duration of the IQ length. IQ sampling rate and capture bandwidth are linked and are selected from the same dialog.
CAPTURE LENGTH
Sets the duration of the waveform data capture. The maximum allowable capture period is dependent on available space on the selected storage device.
Sets the sampling bit format (32-bit floating decimal, 32-, 16-, 10-, or 8-bit integers).
SAVE TO FILE
Toggles automatic or manual file saving. When set to manual, touch the SAVE CAPTURE button to save the next completed IQ capture.
SAVE CAPTURE
Saves captured data to a file when SAVE TO FILE is set to Manual.
FILE NAME PREFIX
Sets the file name prefix of the capture file. Files are stored a “Captures” folder internally or to USB storage media. File naming contains the following:
prefix_year-month-day-time-##_capturetime in ns_number in scientific notation.dgz or .dgzm.
STORAGE DEVICE
Sets the capture file save location. You can select Internal or one of the available USB ports when storage media is detected.
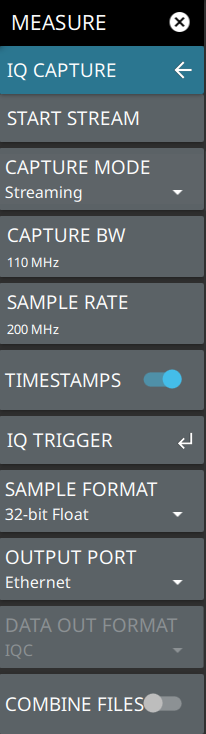
IQ STREAMING Menu
IQ STREAMING Menu
START STREAM
Touch this button to start IQ data streaming from the selected output port. When streaming is initiated, this button changes to STOP STREAM and can be touched to stop the stream.
CAPTURE MODE
Selects the IQ capture mode:
• Single for a one-time capture to internal or external (USB) storage (refer to IQ CAPTURE Menu)
• Continuous for capture to internal or external (USB) storage (refer to IQ CAPTURE Menu)
• Streaming for continuous IQ data streaming out of the Ethernet, USB, or Data Out port.
CAPTURE BW
IQ capture bandwidth is the frequency range of data to be collected for the duration of the IQ length. IQ capture bandwidth and sampling rate are linked and are selected from the same dialog.
SAMPLE RATE
Sets the IQ sampling rate of data to be collected for the duration of the IQ length. IQ sampling rate and capture bandwidth are linked and are selected from the same dialog.
TIMESTAMPS
Toggles data collection timestamps on or off (Refer to the IQ Capture/Streaming Measurement Guide, PN: 10580-00490).
Sets the sampling bit format (32-bit floating decimal, 32-, 16-, 10-, or 8-bit integers).
OUTPUT PORT
Selects the output port to stream the IQ data.
DATA OUTPUT FORMAT
Selects the data out format of IQC or PCIe. IQC is the default format and is intended for use with the MA25424A IQ Data Converter (Refer to the IQ Capture/Streaming Measurement Guide, PN: 10580-00490). PCIe is intended for use with the MA25101A IQ Streaming PCIe kit (refer to the MA25101A User Guide, PN: 10580-00476). Note that changing to PCIe will require the application to reload and the analyzer will be unresponsive during that time.
COMBINE FILES
IQ streams are captured in individual files that are combined once the stream stops. When this toggle is on, files will be concatenated by the instrument at the end of the stream into one file. This can be time consuming depending on the stream time. You can also save the streams as individual files and use the IQ Streaming Tools to combine the files.
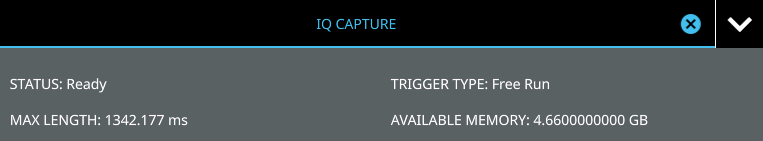
Once the IQ Capture menu is accessed, the IQ CAPTURE table is displayed at the bottom of the screen.
IQ CAPTURE Table
The IQ CAPTURE table provides the following:
• STATUS: Current status of the IQ Capture. When a capture is in process, “Saving (xx%)” will be shown with an X to stop the current capture. When streaming is in process, the status will show “Streaming.”
• TRIGGER TYPE: Indicates the currently selected IQ trigger type.
• WAITING FOR TRIGGER: Indicates the capture has been started but is waiting for a trigger to initiate.
• MAX LENGTH: Indicates how long a capture can be with the current settings and available storage.
• AVAILABLE MEMORY: Indicates how much storage space is available on the target device (internal or external).
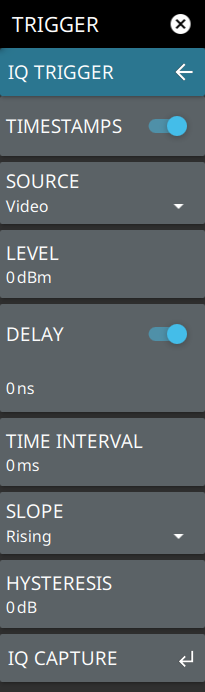
IQ TRIGGER Menu
Note
Trigger commands are shared between IQ capture and zero span, so these two functions are mutually exclusive.
IQ TRIGGER Menu
TIMESTAMPS
toggles data collection timestamps on or off (Refer to the IQ Capture/Streaming Measurement Guide, PN: 10580-00490).
SOURCE
The SOURCE button offers several triggering options depending on which view mode the instrument is set:
• External 1 or 2: A TTL signal applied to the selected External Trigger MCX input connector causing a single capture. After the capture is complete, if mode is single, the capture will stop waiting for triggers until capture is started again. If mode is continuous, once the capture is saved, it will look for the next trigger event to initiate another capture. Any trigger made during the capturing or saving period will be ignored.
• Free Run: When trigger is free run (or manual), a trigger is only initiated when the START CAPTURE button is pressed or when a remote command is sent.
• Video: Sets the video trigger level. When RF energy is detected above that level, a capture is initiated. Note that the user must first press START CAPTURE before the analyzer will begin looking for the trigger.
LEVEL
Used when the trigger source is set to Video. Sets the video trigger level threshold that initiates a capture. The level crossing applies to rising, falling, or both edges. Use the hysteresis setting below to adjust the sensitivity of the trigger level.
DELAY
Sets the IQ trigger delay when the trigger source is not set to Free Run. IQ trigger delay can be set to positive and negative values. A negative value includes data from the specified time before the trigger event.
TIME INTERVAL
Used to set a periodic trigger event. The analyzer waits the user defined amount of time between trigger events.
SLOPE
Used when the trigger source is set to External or Video. Sets the trigger slope to rising, falling, or both. When slope is set to Both, the analyzer triggers on both the rising and falling edges. Triggering on both rising and falling edges is not available in zero span.
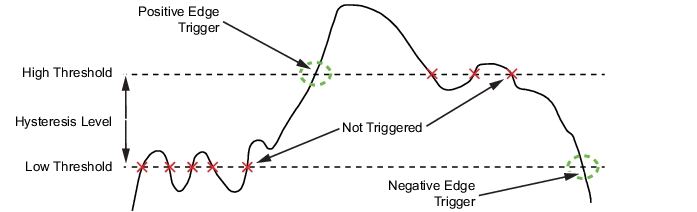
HYSTERESIS
Hysteresis is used to address noisy trigger signals. The hysteresis setting adjusts the sensitivity of the trigger system (the difference between the firing level and the arming level as shown in Figure: Trigger Levels and Hysteresis). A low hysteresis value sets the arming and firing levels close to each other, meaning a small signal change will cause a trigger. A large hysteresis value sets the arming and firing levels far apart, meaning a large signal change will be required to cause a trigger.
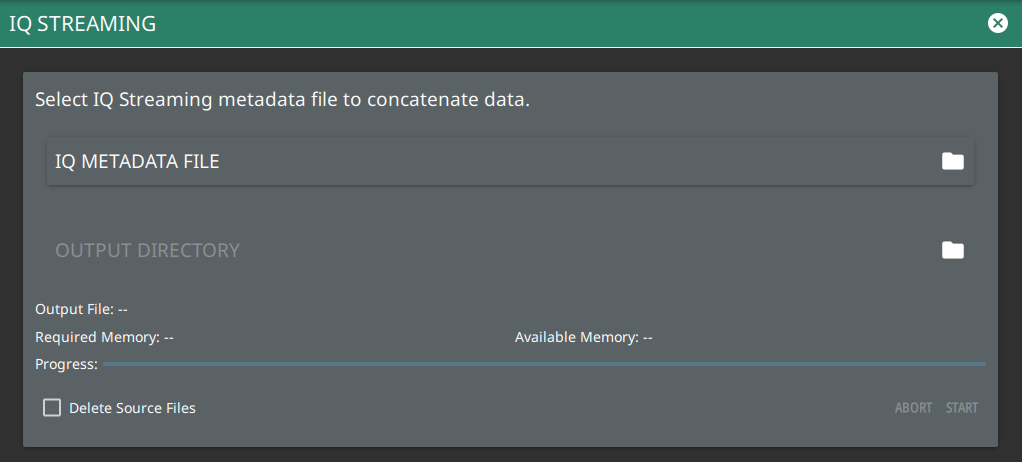
The IQ STREAMING menu allows you to concatenate an existing IQ metadata file (.dgzm) with a session of IQ data files (.dgz) that were streamed to a USB device after the stream operation is complete. The data files must all come from the same stream session.
1. Access the System menu (3-line icon in the upper left corner).
2. Press TOOLS to access the instrument tools menu, then select IQ STREAMING.
IQ Streaming
1. Touch IQ METADATA FILE and then select the metadata file that you wish to concatenate with IQ data streams. All of the data stream files in the selected directory will be concatenated with the metadata file.
2. Touch the OUTPUT DIRECTORY and select the destination for the concatenated files. If desired, select Delete Source Files.
3. Press START to begin the concatenation. The progress bar will indicate relative progress.
Note
Concatenating files can be time consuming depending on the streaming parameters and time. The process can be much faster if performed on a PC using your instrument PC application. Refer to the PC software chapter of the product’s user guide for details on using this application.
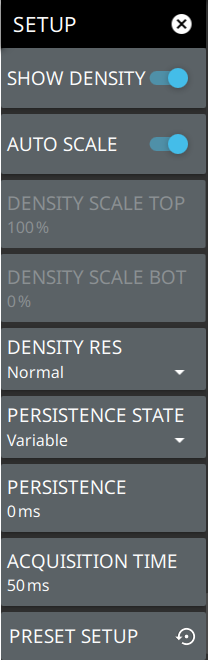
SETUP Menu (RF Spectrum View)
SETUP Menu (RF Spectrum View)
SHOW DENSITY
Toggles the density display on or off. Density displays the relative time density of a signal in a color scale ranging from blue to red. Signals that persist longer or more often during the acquisition time are indicated in red color. Brief transient signals are shown in blue color.
AUTOSCALE
When toggled on, automatically adjusts the DENSITY SCALE TOP and DENSITY SCALE BOT settings of the density display based on the amplitude of the signal.
DENSITY SCALE TOP
Sets the percentage of signal time for the top (red) density scale.
DENSITY SCALE BOT
Sets the percentage of signal time for the bottom (blue) density scale. Any signal that appears at a rate lower than the DENSITY SCALE BOT setting will not appear in the density plot.
DENSITY RES
Density resolution sets the FFT size of the RTSA capture. Normal resolution sets a 512 point FFT; High resolution sets a 1024 point FFT. Higher resolution gives finer frequency detail to the density display, but increases POI. Lower resolution will result in a lower POI, but gives less frequency detail to the density display.
PERSISTENCE STATE
Toggles the persistence state between Variable or Infinite. Infinite persistence means the density plot will not fade away after a signal is no longer present. It is useful for seeing very fast and infrequent signals. Variable persistence sets a user defined time for the density colors to fade. Longer persistence values can be used to best illustrate the signals being observed.
PERSISTENCE
Sets the decay time of the density display.
ACQUISITION TIME
The acquisition time sets the update interval for each spectrum trace, spectrogram line, and density display. During the acquisition interval, spectral data from multiple FFTs of the input signal are taken and combined. The acquisition time is adjustable to allow resolving multiple, brief signal events in time and to observe longer term behaviors.
PRESET SETUP
Presets the color setup settings.
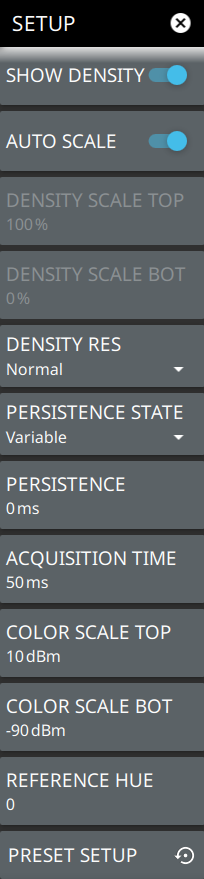
SETUP Menu (Spectrogram View)
SETUP Menu (Spectrogram View)
SHOW DENSITY
Toggles the density display on or off. Density displays the relative time density of a signal in a color scale ranging from blue to red. Signals that persist longer or more often during the acquisition time are indicated in red color. Brief transient signals are shown in blue color.
AUTOSCALE
When toggled on, automatically adjusts the DENSITY SCALE TOP and DENSITY SCALE BOT settings of the density display based on the amplitude of the signal.
DENSITY SCALE TOP
Sets the percentage of signal time for the top (red) density scale.
DENSITY SCALE BOT
Sets the percentage of signal time for the bottom (blue) density scale. Any signal that appears at a rate lower than the DENSITY SCALE BOT setting will not appear in the density plot.
DENSITY RES
Density resolution sets the FFT size of the RTSA capture. Normal resolution sets a 512 point FFT; High resolution sets a 1024 point FFT. Higher resolution gives finer frequency detail to the density display, but increases POI. Lower resolution will result in a lower POI, but gives less frequency detail to the density display.
PERSISTENCE STATE
Toggles the persistence state between Variable or Infinite. Infinite persistence means the density plot will not fade away after a signal is no longer present. It is useful for seeing very fast and infrequent signals. Variable persistence sets a user defined time for the density colors to fade. Longer persistence values can be used to best illustrate the signals being observed.
PERSISTENCE
Sets the decay time of the density display.
ACQUISITION TIME
The acquisition time sets the update interval for each spectrum trace, spectrogram line, and density display. During the acquisition interval, spectral data from multiple FFTs of the input signal are taken and combined. The acquisition time is adjustable to allow resolving multiple, brief signal events in time and to observe longer term behaviors.
COLOR SCALE TOP
Defines the amplitudes where the top color on the color setup bar are applied. Any measurement above this amplitude will appear black on the spectrogram window (shown only in Spectrogram).
COLOR SCALE BOT
Defines the amplitudes where the bottom setting colors on the color setup bar are applied. Any measurement below this amplitude will appear black on the spectrogram window (shown only in Spectrogram).
REFERENCE HUE
Allows you to customize the Spectrogram color range (Color Bar) and Hue values. The color limits and the reference hue are based on a 360-degree color wheel where default 0 is red (255 0 0) (shown only in Spectrogram).
PRESET SETUP
Presets the color setup settings.
Refer to the sections below for additional setup menus when using advanced measurements: