Marker parameters are set using the MARKER Menu. Refer to the figure below when working with this section.
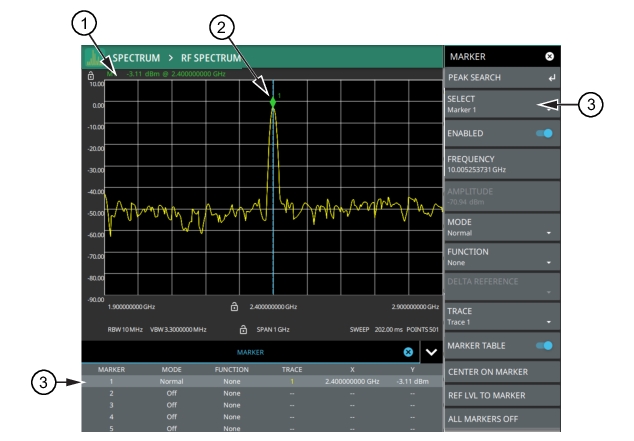
Marker Menu and Marker Table
1. RF Spectrum view marker information display.
2. Marker located on trace. The active marker is indicated with solid green fill, other markers will show with a hollow fill, fixed markers show as a green X. The dashed vertical line is attached to the active marker and facilitates touch operations. Either the marker or the line can be dragged into position, and either can be double tapped to open a number of peak search options.
3. Selected marker in the MARKER menu and in the MARKER table. The marker table shows all of the marker parameters and measurement values. You can edit marker parameters from the marker table as well as from the MARKER menu.
Placing a Normal Marker
1. Select MARKER to display markers. If markers were off, Marker 1 will automatically be made active at the current center frequency.
2. Select another marker using MARKER > SELECT, then select one of 12 available markers. If the marker was off, the marker will be made active and placed at the center frequency. If the marker was on, it will be made the active marker. You can enable all 12 markers and place them separately on traces, cursors, or set them as a fixed marker at a static frequency and amplitude.
3. Place a marker by first selecting it as the active marker, then do one of the following:
a. Enter a new FREQUENCY value from the MARKER menu. The frequency can be entered manually or adjusted by using the slider or the + and – buttons to move the marker to the left and right.
b. Drag the marker on the trace (note that anywhere on the vertical dashed blue line can be touched to drag a marker’s position).
c. Use the PEAK SEARCH menu and the desired peak search function to automatically find signal peaks (refer to MARKER PEAK SEARCH Menu). Some peak search functions can be accessed by double tapping the marker or the blue marker line.
Placing a Fixed Marker
Fixed markers are set up the same as normal markers above, but are set to Fixed using the MODE button. In addition to setting a fixed frequency, you can set a fixed amplitude. Fixed markers are typically used as a reference marker when measuring amplitude differences relative to an absolute value.
Placing a Delta Marker
When a delta marker is on, its position data is relative to its reference marker. For example, if Marker 2 is set as a delta marker, the delta reference is set to Marker 1. To set a delta marker and its reference:
1. Activate either a normal or fixed marker and place it in a reference location as described previously.
2. Activate a delta marker using MARKER > SELECT > Marker #, then select MODE > Delta.
3. Place the active delta marker by doing one of the following:
a. Enter a new FREQUNCY value.
b. Drag the marker on the trace (note that anywhere on the vertical dashed blue line can be touched to drag a marker’s position.
c. Use the PEAK SEARCH menu and the desired peak search function to automatically find signal peaks (refer to MARKER PEAK SEARCH Menu).
A delta marker is labeled with a green delta symbol between each marker number. For example, delta Marker 2 relative to Marker 1 is displayed as “2Δ1”. If another marker is desired to be the reference marker, select the delta marker as the active marker and then use DELTA REFERENCE > Marker # to select the desired reference marker number.
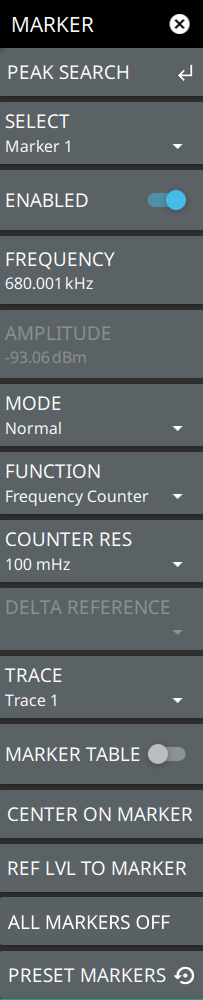
Turns on the selected marker if it is off or makes it the active marker if it is already turned on. Selecting the MARKER menu button for the first time will turn on Marker 1 as a normal marker at the center frequency, and open the MARKER menu. Selecting the MARKER menu button thereafter opens the MARKER menu to the current active marker, which is displayed in the upper left-hand corner of the screen. When a marker is turned on, it is a normal marker positioned at the center frequency of the selected trace.
ENABLED:
Enables the selected marker. When the toggle is off, the marker is disabled and not shown on the screen.
FREQUENCY
Displays the marker frequency. For delta markers, the frequency is relative to the reference marker. Change the marker frequency by dragging it to the desired location. You can also change the marker frequency by pressing the FREQUENCY button and changing it manually using the keypad controls.
AMPLITUDE
Displays the current marker amplitude. When the marker mode is set to Normal or Delta, the amplitude is set by the trace. In that case, the amplitude is not settable by the user. The button is grayed out, but the value is still updating with every sweep. If the marker is a Fixed marker, the amplitude value can be changed by dragging the marker to the desired location or by directly entering the amplitude using the keypad control.
MODE
Select marker preference:
• Normal: A Normal marker is also known as a tracking marker. The frequency is fixed but the amplitude value varies from sweep to sweep.
• Delta (Δ): A Delta (Δ) marker displays the delta frequency and amplitude between itself and a reference marker. If Marker 1 is selected to be a Delta marker, then Marker 2 is turned on as a reference marker for Marker 1 and it becomes a Normal marker at the same location. The reference marker can then be switched to a Fixed marker if desired.
• Fixed: A Fixed marker has a fixed amplitude and fixed frequency, which are defined by the user and not related to the trace or sweep data.
FUNCTION
Sets the function of the currently selected marker to None, Noise, Frequency Counter, or Quasi-Peak. For more information about using marker functions, refer to Marker Functions.
COUNTER RESOLUTION
Available when the marker function is set to Frequency Counter. This setting adjusts the frequency counter marker resolution to 1 Hz, 100 mHz, 10 mHz, or 1 mHz. Lower resolutions will result in greater peak accuracy, but a slower sweep.
DELTA REFERENCE
Selects the Reference marker for a Delta marker. A Delta marker cannot be its own reference. Only Fixed and Normal markers may be used as a reference for Delta markers.
TRACE
Selects the trace number to which the marker is currently attached.
MARKER TABLE
Toggle on or off the marker table displayed below the screen. Refer to Marker Table.
CENTER ON MARKER
Sets the center frequency to the currently active marker’s frequency value.
REF LVL TO MARKER
Sets the reference level to the currently active marker’s amplitude value.
ALL MARKERS OFF
Turns all markers off, but markers will retain their last frequency position once re-enabled.
PRESET MARKERS:
Presets marker selections to default values.
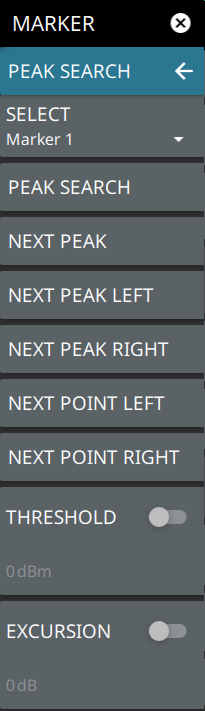
MARKER PEAK SEARCH Menu
Note
Double tapping a marker opens a quick peak search menu with some of the below features.
PEAK SEARCH Menu
PEAK SEARCH
Returns to the main MARKER menu.
SELECT
If the selected marker is off, it will be turned on and the selected marker positioned at the peak of Trace 1. If the selected marker is on, then it will become the active marker and any subsequent actions in the PEAK SEARCH menu will apply to the selected marker. If no markers are on, pressing the PEAK SEARCH button on the control panel will turn on Marker 1 at the peak of Trace 1.
PEAK SEARCH
Moves the selected marker to the highest peak.
NEXT PEAK
Moves the selected marker to the next highest peak regardless of location.
NEXT PEAK LEFT
Moves the selected marker to the next peak left of its current position.
NEXT PEAK RIGHT
Moves the selected marker to the next peak right of its current position.
NEXT POINT LEFT
Moves the selected marker one display point to the left of its current position. Useful for fine tuning the position of a marker.
NEXT POINT RIGHT
Moves the selected marker one display point to the right of its current position. Useful for fine tuning the position of a marker.
THRESHOLD
If turned on, sets the threshold that a peak has to achieve to be considered a peak.
EXCURSION
If turned on, sets the excursion value that a peak amplitude must rise and fall over the peak threshold to qualify as peak.
Marker Functions
Noise Markers
Noise Markers use an averaging routine applied to multiple data-point groups to calculate the readout, which is typically comparable to using 1 Hz bandwidth filtering. Because the noise marker routine uses groups of data points for the calculation, the noise marker should not be placed in close proximity to measurable signals. You can observe this effect by moving the marker further away from a signal until the marker readout stabilizes to a more consistent value. Noise markers should be used with an RMS/Avg detector type for proper measurement. When a noise marker function is selected, the marker amplitude value is displayed in amplitude units/Hz, which is the noise level within the resolution bandwidth filter. Delta markers can also be put into a noise function, but the reference marker must also be a noise marker. If they are different functions, one will be updated to match the other. Fixed markers are not allowed to be set to a noise function, so if a noise marker is changed to fixed mode, the function will automatically be set to off.
Frequency Counter Marker
Sets the frequency counter for the selected marker. Marker frequency values are normally limited in resolution to individual display pixels. Each pixel may represent multiple frequencies. When counter marker is enabled, a higher resolution digital signal processing is used within the region of the counter marker to determine a more precise frequency. Using counter marker in association with marker to peak will result in the frequency of the signal peak to a much higher displayed resolution. Note that frequency accuracy is affected by the RBW setting, and sweep times may be longer when using counter marker because of the additional signal processing. Frequency Counter markers are not available in zero span.
Quasi-Peak Marker
Quasi-Peak markers are designed to provide a weighted average amplitude for pulsed or high AM content signals. Typically, the result from a Quasi-Peak measurement will be lower than the same signal measured with a peak detector. When a marker function is set to Quasi-Peak, the resolution bandwidth and video bandwidth are automatically set and the amplitude is evaluated at the marker frequency according to the CISPR 16-1-1 specification.
Quasi-Peak markers can only be applied to signals below 1 GHz. Quasi-Peak markers are not available in zero span. Typically, when using Quasi-Peak markers, the amplitude axis is set to dBµV. This is set via: AMPLITUDE > Y AXIS UNIT > dBµV.
One or more markers can be enabled to apply the Quasi-Peak function. If the Quasi-Peak marker is set on a signal, at the end of each sweep the analyzer tunes to the position of each marker and remeasures the marker amplitude applying the CISPR time constants and filters. The CISPR filter of 200 Hz, 9 kHz, or 120 kHz is applied automatically depending on the marker frequency as follows:
• Band A: 9 kHz to < 150 kHz, 200 Hz filter
• Band B: 150 kHz to < 30 MHz, 9 kHz filter
• Band C&D: 30 MHz to 1 GHz, 120 kHz filter
Note
The functionality of frequency counter and quasi-peak marker functions is disabled in AM/FM Audio measurement, so only the user set marker frequency value will be displayed.
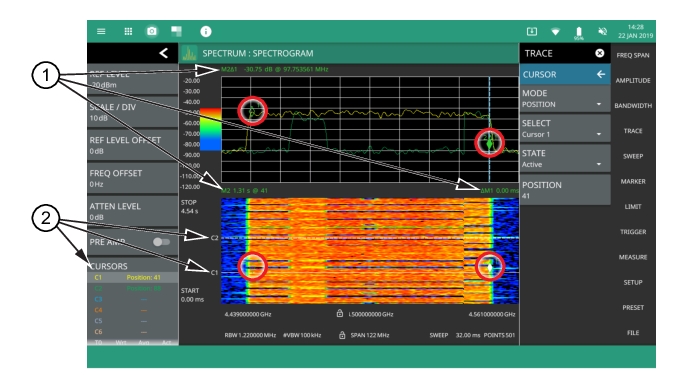
Spectrogram with Cursors and Markers
In the spectrum window, markers are shown as hollow green diamonds on the trace to which they are assigned. Active markers have a solid fill with a vertical dashed line that can be used to drag the marker position. The dashed line matches the trace color to which the marker is assigned. In the spectrogram window, markers are shown as hollow green diamonds on the cursor to which they are assigned. The active marker is shown with white fill and its time and position values are displayed in green text at the upper left side of the display. In this example, the active marker is set to Cursor C2 and is measuring a change of amplitude between two different points in time. Markers can be placed on different cursors to help you compare measurements at different points in time as well as frequency.
Spectrogram with Cursors and Markers
1. Markers: Displays the selected marker value. Marker values at the top of the spectrum display will show the current frequency and amplitude values of the active marker and its type. In this case, marker 2 is set to a delta marker relative to Marker 1. Marker values at the top of the spectrogram window show the current time or position of the active marker (left) and other marker information such as delta time (right). In this case, marker 2 is active and is at position 41 and has a relative time delta of 0 ms. Note that you can set a marker on any cursor to measure relative time differences between signal events as well as frequency and amplitude differences. Markers displayed on traces and cursors (encircled in red) show as green diamonds with the active marker in white fill.
2. Cursors: Cursors are shown on the spectrogram as white dashed lines. The active cursor is a solid white line. Cursors can be directly selected and dragged to position on the display or set via the TRACE > CURSOR menu. Cursors and their settings can also be accessed via the status panel. The start time is the most recent completed sweep and the beginning of the spectrogram. The stop time is the total time length of the spectrogram, essentially the amount of time it takes for a completed sweep to get from the bottom to the top of the spectrogram diagram with the current settings.
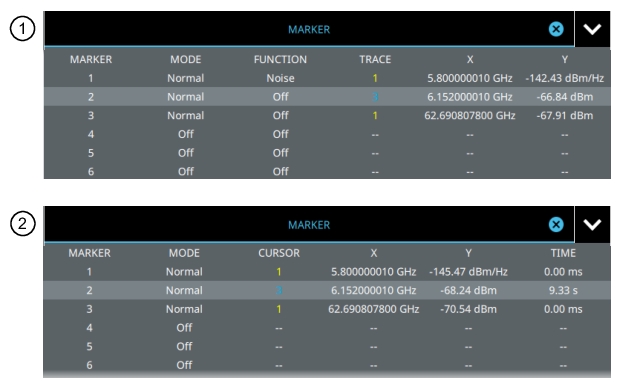
Marker Table
The marker table display is useful for displaying many marker parameters at once. The examples shown are for the regular Spectrum view (1) and for Spectrogram view (2). Both marker tables show the marker mode and corresponding X and Y values. In spectrum view, the marker table shows the marker function and trace to which it is selected. In Spectrogram view, the marker table shows the time value and the cursor to which it is selected. The selected marker is displayed with a highlighted background. Table controls are located on the right of the header. Select the down or up arrow to collapse or expand the table, press X to close the table.
Marker Table
You can select and change a marker’s parameters by selecting the marker from either the MARKER menu or the MARKER table.
The currently selected marker’s value is shown at the top left of the spectrum window with its current amplitude and frequency values.
The selected marker is highlighted on the trace display.