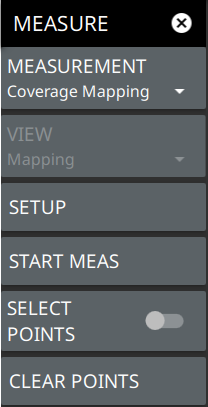
To select EMF measurement go to main menu and press MEASURE > MEASUREMENT >Coverage Mapping. The coverage mapping measurement is set up using the SETUP Menu (Coverage Mapping). The Coverage Mapping (Option 431) provides signal strength mapping on the instrument display and will plot color-coded signal values at GNSS (GPS) coordinates for the following measurements:
• Channel Power: The total power within the set channel bandwidth.
• Spectral Density: The measure of the signal power content versus frequency.
• RSSI: The received signal strength indicator mode represents the amount of the received power level of the radio signal, after antenna and cable gains/losses.
Note
The Coverage Mapping option for outdoor signal mapping requires an active GPS antenna to be connected to the instrument. Offline maps will need to be uploaded to the instrument if an Internet connection is not available. Refer to Map Tool. Indoor coverage mapping does not require GNSS (GPS).
Refer to the previous sections in this chapter for details and menu overviews of general spectrum analysis measurements including setting up frequency and bandwidth parameters, sweep settings, trigger types, attenuator options, and preamp settings. Once coverage mapping is selected, start the mapping measurement via MEASURE > START MEAS.
Note that the coverage mapping setup menu is common to both map types.
Outdoor Coverage Mapping
With a valid GNSS (GPS) signal, the instrument identifies the current location on the displayed map with a location pin. As the location changes during a measurement, colored-coded dots corresponding to the received signal strength/power are placed at distance or time intervals. Using GNSS (GPS) for latitude, longitude, and altitude, data is automatically saved for each location. The instrument logs data automatically based on either a set time or distance interval. If there is no map available when making the measurements, it is still possible to save all of the data to a KML file and then combine the data with a map using other third party tools that can work with KML data. You may also recall a map after taking the data without having to save and recall the measurement data. See Figure: Coverage Mapping (Outdoor) for an overview of the outdoor coverage mapping interface.
Note
When selecting outdoor coverage mapping and the GNSS (GPS) is off or is turned off, GNSS (GPS) will be enabled with a notification dialog. Aborting the GNSS (GPS) fix from the dialog does not allow the instrument to start a coverage mapping measurement.
When saving CSV and KML files map point measurement data, the saved data is cumulative of all data points on the map or measurements since the map points were last cleared.
Ensure to save and clear current measurement points once the maximum number of measurement points are reached.
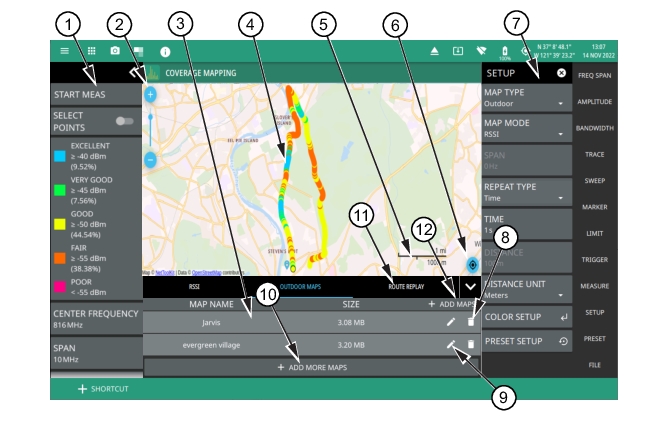
Coverage Mapping (Outdoor)
1. The coverage mapping status panel provides quick access to common settings and allows you to start and stop a coverage mapping measurement. A color-coded signal strength legend including the corresponding percentage values are also displayed. See STATUS PANEL (Coverage Mapping).
2. Select map zoom tool to increase (+) or decrease (-) zoom level. You can also drag the zoom level indicator up or down, or you can pinch to change zoom level.
3. Tabular section displays the following three measurement sections:
• Current map measurement mode section includes the total number of points, average, minimum and maximum values.
• Outdoor maps section lists a number of outdoor maps and an option to add more maps.
• Route replay section consists of current map mode, its value and quality. It also includes navigation controls displayed as arrow heads to either move up/down single point or in increments of five.
4. The map display area shows map data for the current area and color-coded dots corresponding to the signal colors that are set up for the recorded measurement data.
5. Map scale shows length for both imperial (miles) and metric (kilometers) units.
6. Re-centering tool centers the current location on the map.
8. Select pencil icon to edit or rename the saved name of the available map.
9. Select trash can icon to delete the unwanted map (s).
10. Select + ADD MORE MAPS to open Map Tool of Tools menu.
11. Select ROUTE REPLAY to replay the path traveled during coverage mapping.
12. Select + ADD MAPS to add more maps.
Indoor Coverage Mapping
Indoor coverage mapping does not use a GNSS (GPS) signal to identify the current location, but rather relies on the user to touch the location pin to where they are located on a building floor plan, or map, that is shown on the instrument display. As the location pin is moved from point to point during a measurement, the map is annotated with dots that are colored-coded to the received signal strength/power. The instrument logs data automatically based on either a set time or distance interval. You may save and recall the measurement as a PNG file or save just the measurement data. See Figure: Coverage Mapping (Indoor) for an overview of the indoor coverage mapping interface.
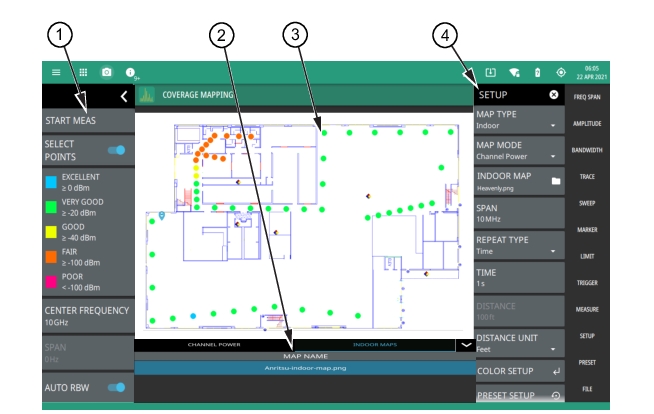
Coverage Mapping (Indoor)
1. The coverage mapping status panel provides quick access to common settings and allows you to start and stop a coverage mapping measurement. A color-coded signal-strength legend is shown at the bottom of the panel. See STATUS PANEL (Coverage Mapping).
2. Tabular measurement data shows the current measurement, measurement value and the list of saved regions.
3. The map display area shows map data for the current area and color-coded dots that correspond to the signal colors that are set up for the recorded measurement data.
4. The SETUP menu is where the coverage mapping measurement settings are configured. See SETUP Menu (Coverage Mapping).
MEASUREMENT Menu (Coverage Mapping)
The coverage mapping measurement SETUP menu is available in MEASURE > MEASUREMENT > Coverage Mapping > SETUP. Once the coverage mapping measurement is selected, the SETUP menu can be quickly accessed by tapping on the summary display area below the spectrum window.
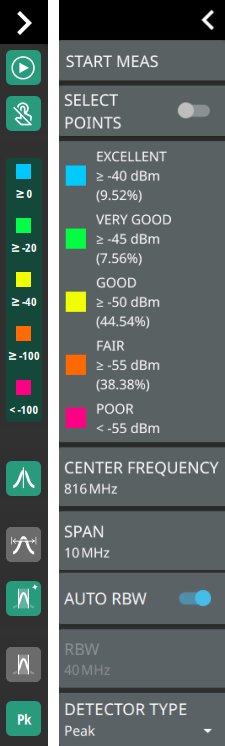
STATUS Panel (Coverage Mapping) with Mini Status Panel Icons
START MEAS
Initiates a coverage mapping measurement. A valid GPS antenna must be connected to the instrument and enabled for a measurement data to be recorded. Note that the START MEAS button also appears on the MEASUREMENT Menu (Coverage Mapping) and provides the same functionality.
SELECT POINTS
Toggle this button to view the value and signal quality of the current measurement.
Color-Coded Legend
This legend shows the colors that are assigned for each power level threshold. Note that at the end of coverage mapping drive, the legend shows the percentage of breadcrumbs for each of the defined power levels. The power levels can be set using the COLOR SETUP Menu (Coverage Mapping).
For example, if the power threshold value of the received signal is greater than or equal to -40 dBm, it is indicated in blue color (excellent). If the power value is less than -55 dBm it is indicated in pink color (poor).
CENTER FREQUENCY
Sets the center frequency of the sweep range. The current span setting will remain constant or will be adjusted to accommodate the start and stop frequency range of the instrument. The center frequency can also be dragged on the display when gestures are not toggled off.
SPAN
Sets the sweep frequency range. The current center frequency will remain constant and the start and stop frequencies will be adjusted to accommodate the new range. Selecting the plus (+) or minus (–) control increments the span value in a 1:2:5 sequence. The span can also be changed by pinching the trace in or out when gestures are not toggled off.
AUTO RBW
When toggled on, the instrument selects the resolution bandwidth based on the current span width. The ratio of span width to RBW can be specified using the SPAN:RBW button.
RBW
The current resolution bandwidth is displayed under the RBW button. Once auto RBW is toggled off, the RBW can be changed using the keypad or the slider controls. Bandwidth values increment in a 1:3:10 sequence, from 1 Hz to 3 Hz to 10 Hz or from 10 Hz to 30 Hz to 100 Hz, for example. Refer to your instrument technical data sheet for the resolution bandwidth range.
DETECTOR TYPE
Selects one of the available detector types. Several detection methods tailor the function of the instrument to meet specific measurement requirements. There are often more measurement points across the screen than display points. The various detection methods are different ways of showing each display point (see Trace Detector Types).
SETUP Menu (Coverage Mapping)
The coverage mapping SETUP menu is available in MEASURE > MEASUREMENT > Coverage Mapping > SETUP. Once coverage mapping is selected, start the mapping measurement via MEASURE > START MEAS. Once the coverage mapping measurement is selected, the SETUP menu can be quickly accessed by tapping on the summary display area below the spectrum window.
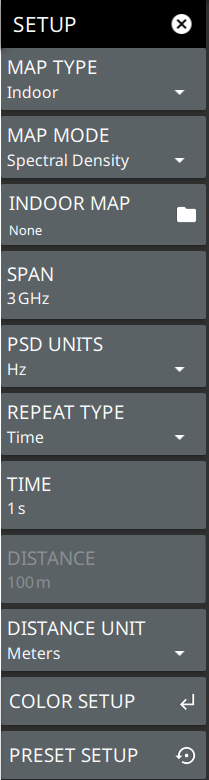
SETUP Menu (Coverage Mapping)
MAP TYPE
Selects indoor or outdoor coverage mapping:
• Indoor Map: The indoor map type is used to select the image/map for mapping from the instrument File system. This image is usually a building floor plan or campus layout drawing.
• Outdoor Map: The outdoor map is used to view the signal strength within a selected region of the outdoor map.
MAP MODE
Selects the measurement type for the map:
• Channel Power: The total power within the set channel bandwidth (SPAN).
• Spectral Density: The measure of the signal power content versus frequency.
• RSSI: The received signal strength indicator mode represents the amount of the received power level of the radio signal, after antenna and cable gains/losses
Note that field strength measurements can be selected from the Amplitude menu. When field strength is enabled, each measurement is adjusted per m^2 based on antenna factors.
INDOOR MAP
When indoor map type is selected above, this button is available and is used to select the image/map for mapping from the instrument File system. This image is usually a building floor plan or campus layout drawing.
SPAN
Sets the current frequency span. For channel power and spectral density measurements, the span is equal to the integration bandwidth. This setting is not available in the RSSI map mode.
PSD UNITS
Selects the spectral density units as either Hz or MHz. This option is enabled only if Map Mode is set to Spectral Density and Field Strength option is enabled in Amplitude menu.
REPEAT TYPE
Selects when a map data point is recorded. The repeat type can be set to a time interval or distance interval. For indoor coverage mapping, time interval will evenly distribute measurement points between two selected positions; distance interval will plot a single point for every position selected by the user.
TIME
When the repeat type is Time, sets the time duration for recording map data points.
DISTANCE
When the repeat type is Distance, sets the distance between recording map data points. When using an indoor map type, the distance mode only marks the data points to where the user drags the location pin.
Sets all coverage mapping setup parameters to default, including color setup.
COLOR SETUP Menu (Coverage Mapping)
The coverage mapping measurement COLOR SETUP menu is available in MEASURE > MEASUREMENT > Coverage Mapping > SETUP > COLOR SETUP. Once the coverage mapping measurement is selected, the SETUP menu can be quickly accessed by tapping on the summary display area below the spectrum window.
COLOR SETUP Menu (Coverage Mapping)
EXCELLENT
Sets the power level threshold for the EXCELLENT color.
VERY GOOD
Sets the power level threshold for the VERY GOOD color.
GOOD
Sets the power level threshold for the GOOD color.
FAIR
Sets the power level threshold for FAIR color.
POOR
Sets the power level threshold for the POOR color.
The Map tool includes an embedded, low detail world base map. The MAP TOOL provides access to downloadable, high detail map tiles for offline use during signal mapping. The map tiles that you download have the same detail that is accessible through an active Internet connection. The map tool can be used directly on the instrument or with the instrument PC software. Files downloaded to the instrument are automatically saved for offline coverage mapping. Files downloaded using the PC software can be exported to a USB drive or directly to an instrument via the instrument IP address or hostname. All tiles are saved to a single map file on the instrument. To manage storage, see Map Tile Usage and Memory. Go to upper left system menu (3 line icon) to access the MAP TOOL and select TOOLS>MAP TOOL.
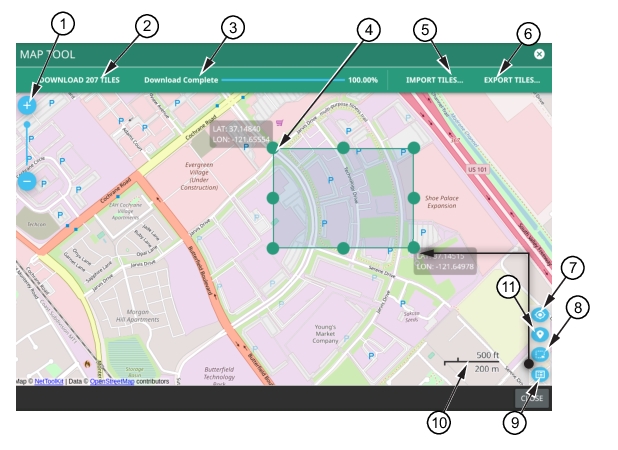
MAP TOOL
1. The map zoom tool is used to increase (+) or decrease (-) zoom level. You can also drag the zoom level indicator up or down, or you can pinch to change zoom level.
2. Indicates the number of map tiles that will be downloaded for the currently selected area. Touch this button to download the map tiles and add them to the current map tile storage. Refer to Map Tile Usage and Memory.
3. Indicates the map tile download progress once the DOWNLOAD ### TILES button is touched. Download times can be long depending on the number of tiles that were generated and the Internet connection speed.
4. The selection area is displayed when toggled on using the selection tool (8). This defines the map tile generator area. The area can be dragged to the desired size using the handles (dots) on the sides and corners. The handle on the side allows you to move just that side, and the handles on the corners allow you to move the corner.
5. IMPORT TILES opens the file system so you can select previously downloaded tiles from internal or external memory.
6. EXPORT TILES opens the file system so you can export downloaded tiles. In the PC application upload icon initiates connection to an instrument and uploads them to the instrument internal storage area (Figure: UPLOAD TILES Dialog).
7. Re-centering tool to center map on current GNSS (GPS) position. A GPS antenna is required for this icon to appear
8. Selection tool when touched selects a desired area on the map.
9. Select Map list icon to view a table of user created maps with their size. You can also edit the name of the map or delete an unwanted map. Refer to Outdoor Coverage Mapping for more information.
10. Map scale shows length for both imperial (miles) and metric (kilometers) units
11. Location pin icon when selected displays all the saved map names.
Downloading and Importing/Uploading Map Tiles
1. Touch and drag the map to the desired area, then use the zoom tools in the upper left to show an area that is centered and is a little larger than the area that you wish to conduct your signal mapping measurements.
2. Touch the selection tool in the lower right, then drag the green box over an area from the upper left to lower right. The selected boundary edges are indicated with latitude and longitude, and the numbers of map tiles that will be downloaded is shown at the top. The green dots can be used as handles to drag an edge or a corner to cover the desired area.
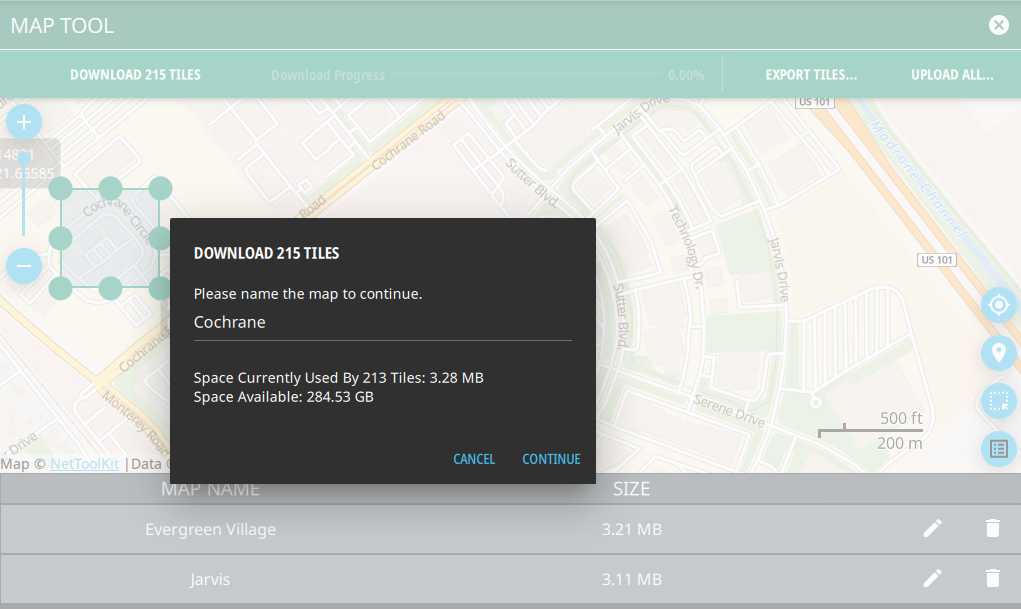
3. Once the desired area is selected, touch DOWNLOAD ### TILES to download the tile set.
4. Enter a name for the map, and press CONTINUE. Select the location pin icon to view the saved map (s). Note that all the saved maps can be viewed in a tabular form in Coverage Mapping measurement mode.
Download ### Tiles Dialog
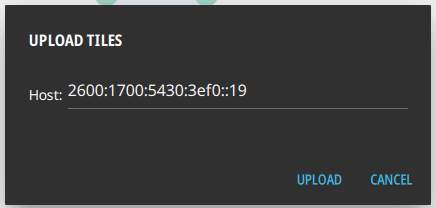
5. If you are using the PC software, click upload icon from the list of available maps to upload the specific map tiles to the instrument. You will see a dialog to enter the instrument IP address for the upload. If not automatically detected, enter the instrument IP address, then touch the upload icon. If more than one map is available, then click UPLOAD ALL... button on the top right corner of the screen, to upload all the maps.
UPLOAD TILES Dialog
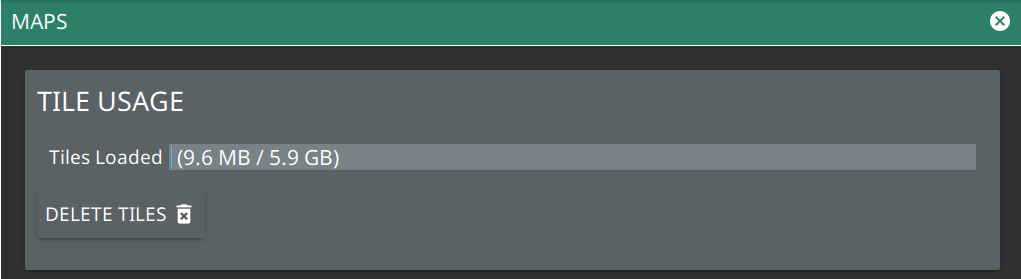
Map Tile Usage and Memory
The instrument can store up to as many tiles as the instrument’s memory. Each time tiles are generated or uploaded to the instrument, they are added to the existing tile storage. Once full, no more map tiles can be added and existing tiles will need to be deleted to make space. Delete tiles from the Settings > MAPS menu, accessed from the top left System menu icon.