 |
|
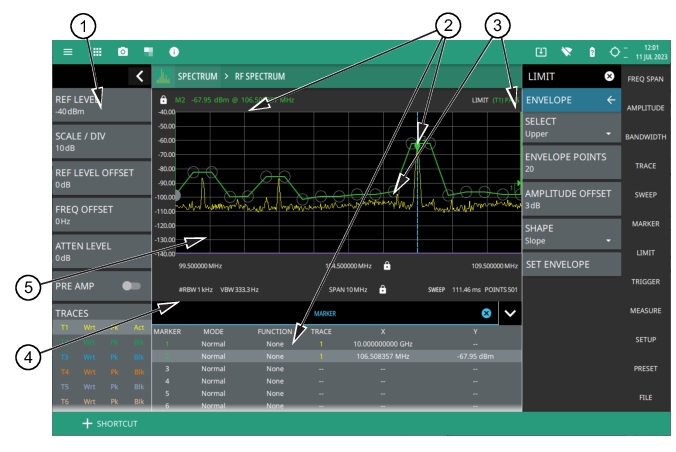 |
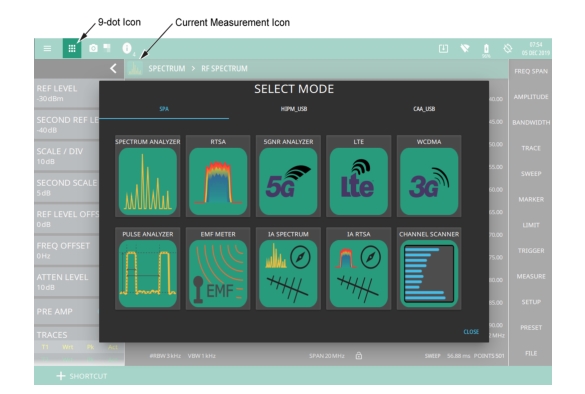
1. Status Panel: Each measurement features a unique status panel that displays settings and information relevant to the current measurement and view settings. Refer to the Status Panel, for more information. 2. Markers: Markers are displayed as green diamonds on the trace to which they are assigned. The active marker is shown as a solid green diamond with a dashed vertical line. The marker amplitude and frequency will be displayed in green text on the top left edge of the display. In this example, a marker is shown at the signal peak with the marker table enabled. Double tap the marker to open a quick access peak search menu. 3. Limit Lines: Limit lines are shown as red (failing) or green (passing) lines with gray circles for each limit line point. Limit lines can be set up point-by-point or by using the envelope feature to quickly set a sloped or square envelope. The currently selected limit line point is shaded in gray. When limit lines are enabled, a pass/fail status is shown in the upper right of the window. If the trace crosses the limit, the trace color will turn red and the limit will indicate a failure. The limit is only applied to the active trace (see Setting Trace Parameters), which is indicated next to the pass/fail. 4. Measurement Settings: The x-axis shows the start, center, and stop frequencies. The y-axis displays the amplitude of the graticule lines. RBW/VBW, span, sweep time, and number of trace point settings are shown along the bottom of the spectrum display. If either resolution bandwidth or video bandwidth is set to manual, the “#” symbol will precede its label. If an offset frequency is entered, the offset value is displayed in the left side status panel. Selecting any of the editable parameters opens the keypad to edit the value directly. Information-only displays cannot be changed. 5. Multiple Trace Display: Each trace has a unique color and each can be set to Clear/Write, Average, Min or Max Hold, Rolling Average, Rolling Min or Max Hold, T1-T2, T2-T2. Traces can have Peak, RMS/Average, Negative, Sample, or Normal detectors. Traces can be set to Active, Hold/View, or Blank. |
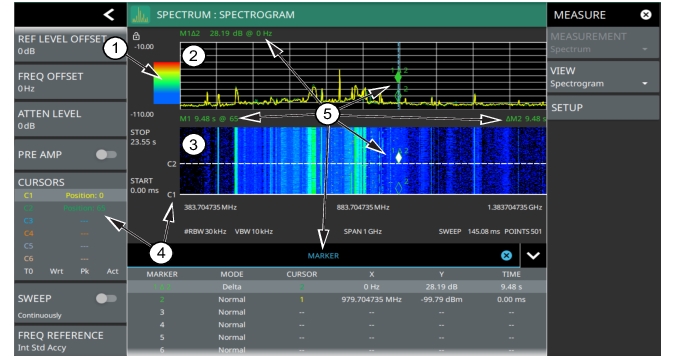 |
1. Color Bar: The color bar is used to adjust the colors displayed at different amplitude levels. The color bar shown here represents the range of colors that will be displayed. This bar can be dragged up or down to adjust the coverage area. If signals or noise is outside of the color bar range, then black is displayed. The color bar top and bottom setting, and the overall hue to the color range is set via the SETUP Menu (Spectrogram View), which can be opened by pressing the color bar. 2. Spectrum Window: The upper display area shows spectrum trace data in the frequency domain. Up to six traces can display data from different times depending on how the corresponding cursors are set in the spectrogram display below. Note that the spectrum display shows trace amplitude (vertical axis) data in the time (horizontal axis) domain. 3. Spectrogram Window: The lower display area shows spectrogram trace data in the time (vertical axis), frequency (horizontal axis), and amplitude (color) domains. The bottom of the spectrogram displays the current sweep at the current time (0 ms) or position 0. When a sweep completes, the entire display is shifted up and the new trace is added to the bottom of the spectrogram. The spectrogram holds 142 sweeps (cursor positions) and the stop time reflects the time taken to complete all of the sweeps. 4. Cursors (C1 to C6): Cursor information for the currently set cursor type (time or position) is shown in the status panel. Cursors are shown on the spectrogram as white lines at the currently set cursor time or position. Refer to Spectrogram with Cursors and Markers. 5. Markers: Marker and marker data are shown in a variety of locations. Markers can be placed on different cursors to help you compare measurements at different points in time as well as frequency. Refer to Spectrogram with Cursors and Markers. |