Vector Network Analyzer (VNA) Measurement Guide : VNA Calibration and Measurements : MEASURE Menu
 
MEASURE Menu
From the main menu select MEASURE menu to choose an appropriate graph type, domain, S-Parameters, display layout. MEASURE menu includes sub menus such as TIME, DISTANCE and REF PLANE EXT
MEASURE Menu
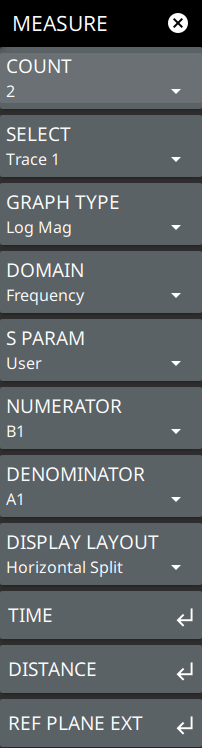
COUNT
Selects the number of trace count. Maximum of 4 traces are supported.
SELECT
Selects the number of active traces to be displayed on the sweep window.
GRAPH TYPE
Selects any of the following graph types for an active trace:
Log Mag: Log magnitude is used to measure return loss at Port 1 (or Port 2), or gain or loss in a DUT that is connected between Port 1 and Port 2.
SWR: Standing wave ratio (SWR) is used to measure the reflection (S11) from the DUT input port or output port.
Phase: Use the Phase or Unwrapped Phase measurement to display the phase in degrees of Sxy. The Phase measurement is contained within a vertical scale of ±180º, whereas the unwrapped phase displays the linear phase without wrapping it at the 180 degrees transitions.
Smith: Smith chart is a plot of input and output impedance of the DUT using S11 versus frequency.
Group Delay: Group Delay graph type is a measure of the time delay of the signals that are propagating through the DUT versus frequency (using S21). Group delay is a good measure of phase distortion through the DUT. Group delay is equal to rate of change of phase over a specified frequency aperture.
Real: Real graph type denotes real part of the complex S-Parameter Sxy.
Imaginary: Imaginary graph type denotes imaginary part of the complex S-Parameter Sxy.
Imaginary Imp: An imaginary graph in the context of a Vector Network Analyzer (VNA) typically represents the imaginary component of complex impedance or reflection coefficients (S-parameters) as a function of frequency. This type of graph is useful for analyzing how the reactive components (inductive and capacitive) of a device under test (DUT) behave over a specified frequency range.
Inverted Smith: An inverted Smith chart is a variation of the traditional Smith chart used in RF and microwave engineering for displaying complex impedance and reflection coefficients in a more intuitive way, particularly for certain types of analysis.
Log Mag/2: Measures 1-port cable loss, using S11 to account for the round trip signal path through the cable. When using reflection data to measure cable loss, the end of the cable must be shorted or must be a perfect open.
Linear Polar: Linear polar graph typically refers to a graphical representation of complex impedance or reflection coefficients (S-parameters) in a polar coordinate system. This representation is useful for visualizing how the impedance of a device changes with frequency or how it behaves in response to varying input signals.
Log Polar: A log polar graph is a specialized type of graphical representation used in Vector Network Analyzers (VNAs) to display the magnitude and phase of S-parameters, particularly useful for analyzing wide-ranging values of impedance or reflection coefficients across a frequency spectrum.
Unwrapped Phase: The unwrapped Phase graph removes the wrapping and plots the phase linearly. Unwrapped phase is obtained by counting the number of transitions of the phase measurement.
Linear Mag: A linear magnitude graph in a Vector Network Analyzer (VNA) is a straightforward representation used to visualize the magnitude of S-parameters (scattering parameters) over a specified frequency range. This type of graph is particularly useful for assessing the performance of RF and microwave components, such as antennas, filters, and amplifiers.
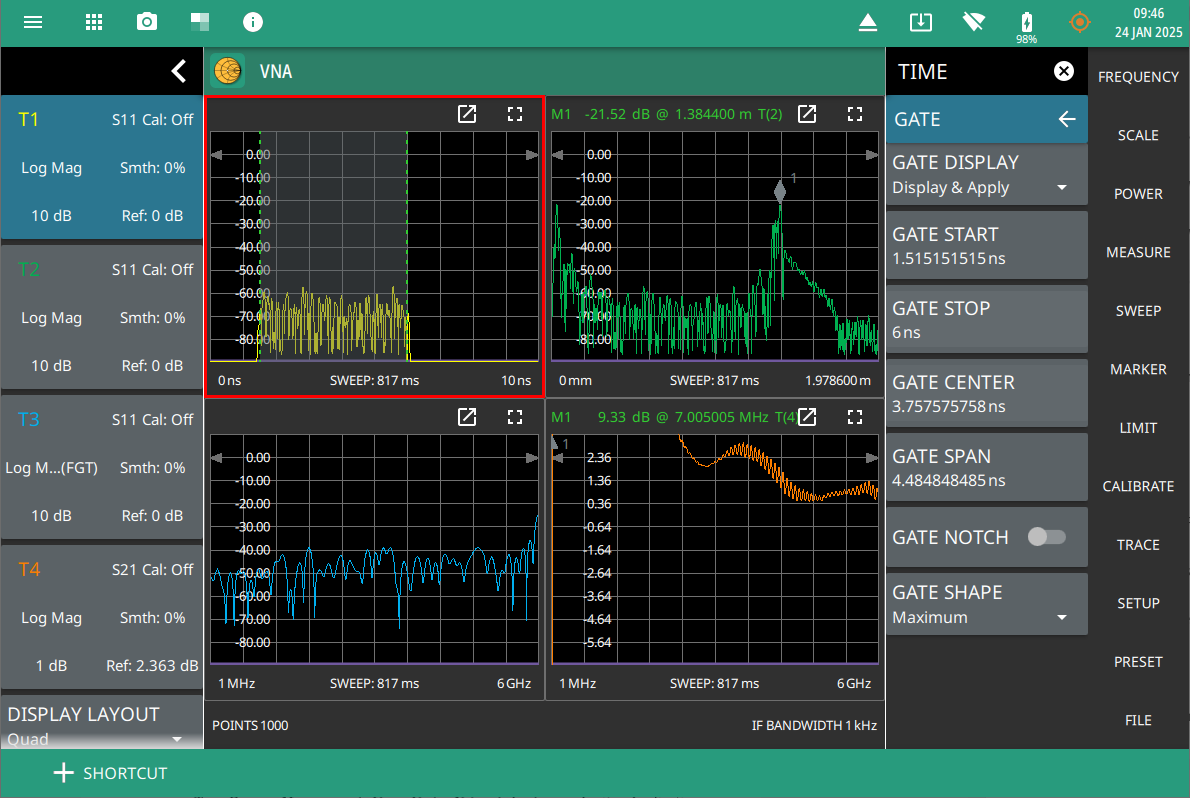
 
Z-Magnitude: A Z-magnitude graph in a Vector Network Analyzer (VNA) displays the magnitude of impedance (Z) as a function of frequency. This type of graph is useful for analyzing how the impedance of a device under test (DUT) varies with frequency, providing insights into the performance characteristics of RF and microwave components.
DOMAIN
Selects any one of the following domain options:
Frequency: Sets the x-axis of the active trace to frequency domain.
Time: Sets the x-axis of the active trace to time domain. Note that time domain is available when Time Domain with Gating Option 2 is installed.
Distance: Sets the x-axis of the active trace to distance domain. Note that distance domain is available when Time Domain with Gating, Option 2 is installed.
Freq Gate: Sets the x-axis of the active trace to frequency gate domain. Note that frequency gate domain is available when Time Domain with Gating Option 2 is installed. Note that status panel indicates ‘(FGT)’ next to the selected graph type only if Domain is set of Freq Gate.
S PARAM
Selects any one of the following S-Parameter options:
S11: Set the measurement to S11 Forward Reflection (receive at Port 1, transmit from Port 1).
S21: Sets the measurement to S21 Forward Transmission (receive at Port 2, transmit from Port 1).
User: Sets the user-defined S-Parameters by choosing a combination of available numerator and denominator values. For example, if numerator is set as B1 and denominator is set as A1 the instrument measures the S11 forward reflection. See Table: User-Defined Numerator/Denominator Combinations.
S21 (Ext. Sens): Forward Transmission represents the measurement in which the signal leaves port 1 and is transmitted to Port 2. In this case an external USB power sensor is used as Port 2.
NUMERATOR
Selects any of one of the following as numerator:
A1: Denotes the reference signal from source Port 1.
B1: Denotes the received power into Port 1.
B2: Denotes the received power into Port 2.
One: Denotes the number 1 as the numerator.
DENOMINATOR
Selects any of one of the following as numerator:
A1: Denotes the reference signal from source Port 1.
B1: Denotes the received power into Port 1.
B2: Denotes the received power into Port 2.
One: Denotes the number 1 as the denominator.
DISPLAY LAYOUT
Selects any of the following display layouts:
Single: Displays the active trace at full size in the sweep window.
Horizontal Split: Displays 2 active traces in the sweep window, with the sweep window divided horizontally into 2 equal rectangles.
Vertical Split: Displays 2 active traces in the sweep window, with the sweep window divided vertically into 2 equal rectangles.
Horizontal Triple: Displays 3 traces in the sweep window, with the sweep window divided horizontally and vertically so that 2 equal rectangles share the lower half of the window, and one wide rectangle occupies the upper half of the window.
Vertical Triple: Displays 3 traces in the sweep window, with the sweep window divided horizontally and vertically so that 2 equal rectangles share the left half of the window, and one wide rectangle occupies the right half of the window.
Quad: Displays 4 traces in the sweep window, with the sweep window divided horizontally and vertically into 4 equal rectangles.
 
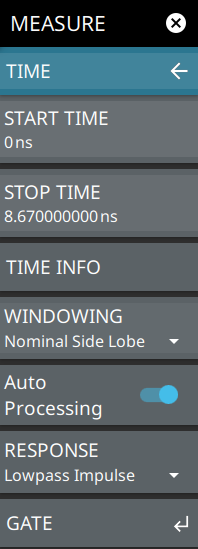
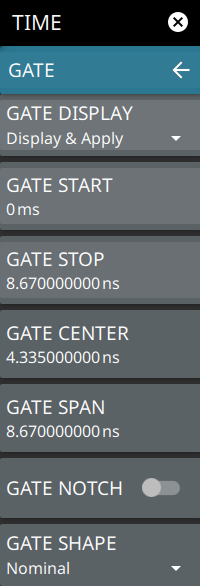
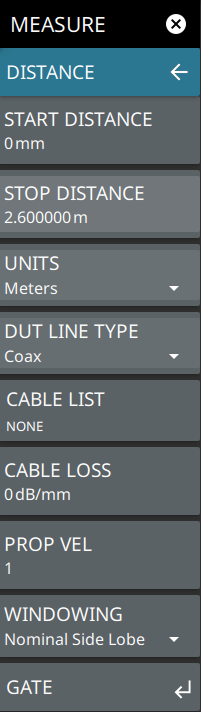
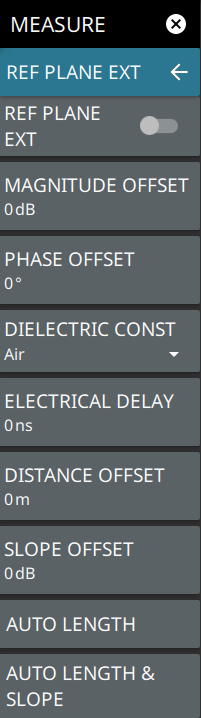
TIME
Opens the TIME Menu.
DISTANCE
Opens the DISTANCE Menu.
REF PLANE EXT
TIME Menu
To access TIME submenu go to main menu MEASURE > TIME.
TIME Menu
 
START TIME
Sets the start time in seconds (s), milliseconds (ms), microseconds (µs) and nanoseconds (ns).
STOP TIME
Sets the stop time in seconds (s), milliseconds (ms), microseconds (µs) and nanoseconds (ns).
TIME INFO
Displays time resolution and maximum usable time for both reflection and transmission.
WINDOWING
Selects one of the following windowing for the measurement:
Rectangular: Rectangular windowing shows the highest side lobe levels (worst) and the greatest main lobe resolution (best).
Nominal Side Lobe: Nominal side lobe windowing shows lesser side lobe levels than rectangular windowing (good) but lower main lobe resolution (very good).
Low Side Lobe: Low side lobe windowing shows less side lobe levels than nominal windowing (very good) but lower main lobe resolution (good).
Minimum Side Lobe: Minimum side lobe windowing shows the lowest side lobe levels (best) but the least main lobe resolution (worst).
Kaiser-Bessel: Kaiser-Bessel windowing shows lower side lobes, but a wider main lobe width for larger Beta values.
Dolph-Chebyshev: Dolph-Chebyshev windowing shows the parameterized side lobe level and a wider main lobe width.
AUTO PROCESSING
Lowpass processing is used to transform frequency domain data to time data (or distance data), when auto processing is turned on. Bandpass processing gets activated when auto processing is turned off, especially for band-limited sweeps with starting frequency not near DC (Such as for waveguide devices). Refer to Site Master Implementation for more information.
RESPONSE
Sets the response to any one of the options mentioned below:
Lowpass Step: Sets the response of the low pass time or distance domain to step response.
Lowpass Impluse: Sets the response of the low pass time or distance domain to Impulse response.
Bandpass Standard: Sets the response of the band pass time or distance domain to standard Impulse response.
Bandpass Phasor: Sets the response of the band pass time or distance domain to Phasor Impulse response.
GATE
Opens the GATE Menu.
GATE Menu
To access GATE submenu go to main menu, MEASURE > TIME > GATE. Figure: Applied Gate Display in Time Domain illustrates the applied gate display of the active trace (T1) set in time domain.
GATE Menu
 
Gate Display
Sets the gate function status to one of the following options:
Hide: When selected, the gate is not displayed on the screen nor applied to the data.
Display: When selected the gate shape is displayed on the screen but the gate filtering is not applied to the data.
Display & Apply: When selected, the gate shape is displayed on the screen, and the gate filtering is applied to the data.
GATE START
Sets the Gate Start value. The units will differ depending on the selected Domain. Refer to MEASURE Menu for information about domain options.
GATE STOP
Sets the stop Gate in either time or distance units, depending on whether the active trace is in the Time Domain or the Distance Domain. In time domain, the units are in seconds (s), milliseconds (ms), microseconds (µs). In distance domain, the units are in meters (m), centimeters (cm), or millimeters (mm).
GATE CENTER
Sets the GATE CENTER in either time or distance units, depending on whether the active trace is in the Time Domain or the Distance Domain.
GATE SPAN
Sets the GATE SPAN in either time or distance units, depending on whether the active trace is in the Time Domain or the Distance Domain.
GATE NOTCH
When GATE NOTCH is set to OFF, the polarity of the Gate is set to keep everything between start and stop. When the GATE NOTCH is set to ON, the polarity of the Gate is set to reject everything between start and stop.
GATE SHAPE
Selects any one of the gate shape value:
Maximum: Sets the gate shape value to maximum.
Wide: Sets the gate shape value to wide.
Nominal: Sets the gate shape value to nominal. The nominal gate shape is the default shape.
Minimum: Sets the gate shape value to minimum.
Note that the gate shape is analogous to the window selection. If the data are truncated with a sharp gate (minimum, related to rectangular window), then maximum resolution is used in determining the gate, but ripple is introduced in the frequency domain. For more gradual gates, the resolution decreases in separating defects, but the size of the artifacts that are added to the frequency domain data also decreases. The window and gate shapes cannot be selected entirely independently because they interact through the transform. In particular, the use of a very sharp gate with a low side lobe window can lead to large errors. The following table shows the recommended combinations.
 
Window / Gate
Minimum
Nominal
Wide
Maximum
Rectangular
OK
OK
OK
OK
Nominal
OK
OK
OK
OK
Low side lobe
 
OK
OK
OK
Minimum side lobe
 
 
OK
OK
 
Note 
Gate Display options in the Gate menu are only available if DOMAIN is set to TIME or DISTANCE.
Applied Gate Display in Time Domain
DISTANCE Menu
To access DISTANCE submenu, go to main menu, MEASURE >DISTANCE.
DISTANCE Menu
 
START DISTANCE
Sets the start distance value when distance domain is selected.
STOP DISTANCE
Sets the stop distance value when distance domain is selected.
UNITS
Select the desired measurement type from the following list:
DUT LINE TYPE
Selects either one of the DUT line type:
Coax: Sets the DUT LINE TYPE as Coax.
Waveguide: Sets the DUT LINE TYPE as Waveguide.
CABLE LIST
Opens the standard or user cable list.
CABLE LOSS
sets the cable loss coefficient from 0.000 dB/m to 5000 dB/m.
PROP VEL
Sets the propagation velocity for the selected cable using the keypad.
WINDOWING
Selects the desired measurement view from the following list:
Rectangular: Rectangular windowing shows the highest side lobe levels (worst) and the greatest main lobe resolution (best).
Nominal Side Lobe: Nominal side lobe windowing shows lesser side lobe levels than rectangular windowing (good) but lower main lobe resolution (very good).
Low Side Lobe: Low side lobe windowing shows less side lobe levels than nominal windowing (very good) but lower main lobe resolution (good).
Minimum Side Lobe: Minimum side lobe windowing shows the lowest side lobe levels (best) but the least main lobe resolution (worst).
Kaiser-Bessel: Kaiser-Bessel windowing shows lower side lobes, but a wider main lobe width for larger Beta values.
Dolph-Chebyshev: Dolph-Chebyshev windowing shows the parameterized side lobe level and a wider main lobe width.
GATE
Opens the GATE Menu.
REF PLANE EXT Menu
To access Reference Plane Extension submenu, go to main menu, MEASURE > REF PLANE EXT.
REF PLANE EXT Menu
 
REF PLANE EXT
Turns on or off the reference plane extension for Port 1.
MAGNITUDE OFFSET
Sets the reference plane extension loss (magnitude offset) on the given channel and port. For transmission S-Parameters this will shift the measurement of the given port by the magnitude offset. For reflection S-Parameters this will shift the measurement of the given port by 2x the magnitude offset. For Site Master applications, only port 1 is available.
PHASE OFSET
Sets the reference plane extension phase offset in degrees for the given channel and port. For Site Master applications, only port 1 is available.
DIELECTRIC CONST
Sets the reference plane extension coaxial or waveguide line dielectric constant type as follows:
Air
Microporus
Other
Polyethylene (This is the default constant for coaxial line type)
Teflon
ELECTRIC DELAY
Sets the reference plane extension time (electrical delay) on the given channel and port. For Site Master applications, only port 1 is available.
DISTANCE OFFSET
Sets reference extension distance offset for the given channel and trace.
SLOPE OFFSET
Sets the reference plane extension slope offset for the given channel and port in dB/GHz. For reflection S-Parameters, the slope will be 2x dB/GHz due to the round-trip nature of the measurement. For Site Master applications, only port 1 is available.
AUTO LENGTH
Auto Length refers to an automated feature that adjusts the measurement reference point based on the physical length of the cables or fixtures connected to the DUT (Device Under Test).
AUTO LENGTH & SLOPE
Slope refers to the rate of change in the measured parameter (such as impedance or reflection coefficient) as a function of frequency. Understanding this slope is crucial for analyzing the behavior of a Device Under Test (DUT) across a frequency range.