Press to open the user designated trace data folder location.
Press to open the save files dialog. Save the file to a user designated folder location.
Set the limit line as Single or Segmented Mode.
Slide the button to the on position to activate the Upper Limit line on the display.
Slide the button to the right for the on position to activate the Lower Limit line on the display.
Click to display the upper level entry field. Type to edit upper level value to position the upper level line. The upper limit line can be also be positioned by using the mouse to point and manually moving the limit line up or down the scale. The amplitude value also changes in the display/entry box.
Click to display the lower level entry field. Type to edit the lower level value to position the lower level line. The lower limit line can be also be positioned by using the mouse to point and manually moving the limit line up or down the scale. The amplitude value also changes in the display/entry box.
Activate the Single Limit Line
1. Press the Limits button as shown in Figure: Limits Menu to activate the limit line screen.
2. Set Mode to Single
3. Switch the UPPER LIMIT button line to the on position (if trace analysis for upper tolerance is required)
4. Switch the LOWER LIMIT button to the on position (if trace analysis for upper tolerance is required)
Edit Single Limit Line
Edit the UPPER LEVEL or LOWER LEVEL line measurement field.
1. Press UPPER LEVEL and edit the value using the Data Entry. The upper limit line will be displayed on the screen if the value entered is within the Y value range. A green line will display if all trace points are below the upper limit line. A red line will display if any trace points are above the upper limit line. A PASS indicator will display in the top right of the trace display if all trace points are below the upper limit line or will display a red FAIL if any trace points are above the upper limit line.
2. Press LOWER LEVEL and edit the value using the Data Entry. The lower limit line will be displayed on the screen if the value entered is within the Y value range. A green line will display if all trace points are above the lower limit line. A red line will display if any trace points are below the lower limit line. A PASS indicator will display in the top right of the trace display if all trace points are above the upper limit line or will display a red FAIL if any trace points are below the lower limit line.
Manual Editing
Change the limit line value manually using the mouse.
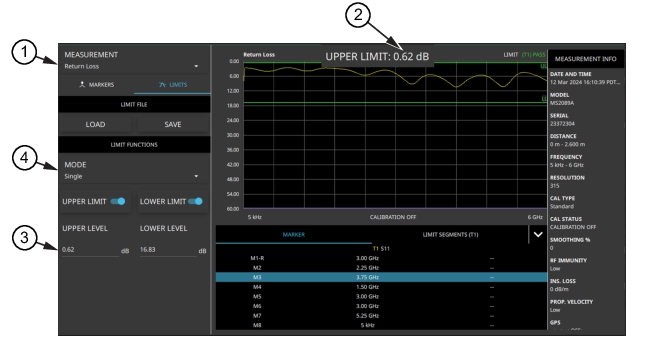
1. Point and drag the limit line up or down to change the power limit value. When moving the line manually, a readout is displayed indicating the limit line measurement location as shown in Figure: Limit Line Measurement Readout
2. Note the limit line readout value is tracked in the upper or lower limit line menu.
Limit Line Measurement Readout
1. Measurement set to Return Loss
2. Upper Limit Line measurement readout tracks the moving limit line