Use this procedure to set segmented limit lines. Only one limit line and one segment can be set at a time. Refer to Enter Numeric Values to enter values.
3. Switch either the UPPER LIMIT or LOWER LIMIT on. The Segment tab will automatically display a 1 indicating that this is segment 1.
Set X1 and X2 Frequency Values
X represents the X axis and frequency on the graph display.
1. Press X1 to enter a Segment 1 frequency value.
2. Press X2 to enter a Segment 1 frequency value. A segment line will display on the trace display.
Set Y1 and Y2 Frequency Values
Y represents the Y axis and power level on the graph display.
If a power segment that has different Y1 and Y2 values, representing a linear type segment, set Y1 and Y2. If a segment that requires the same Y1 and Y2 values over a frequency range, use the Y OFFSET to set the power level value.
1. Press Y1 to enter a Y1 power level value.
2. Press Y2 to enter a Y2 power level value.
3. Press Y OFFSET to enter a Y1 and Y2 power level value.
Add Another Segment
Use this procedure to add another segment top the trace data display.
1. Press ADD SEGMENT. The SEGMENT tab will display an incremented segment number. An additional parameter line is added to the segments parameter screen as shown in Figure: Segments Parameter Screen.
2. Add segment parameters as noted from Step 3 through Step 3 above or press an entry in the segments parameter field and type a new value.
DELETE SEGMENT
Use this procedure to delete a single segment.
1. Press the SEGMENT Tab.
2. Press the segment to be deleted.
3. Press DELETE SEGMENT.
CLEAR ALL
Use this procedure to delete all Segment Entries.
1. Press SAVE to save the trace data display if needed. If not saved, the segment limit lines parameter values will be lost.
2. Pressing CLEAR ALL removes all segments.
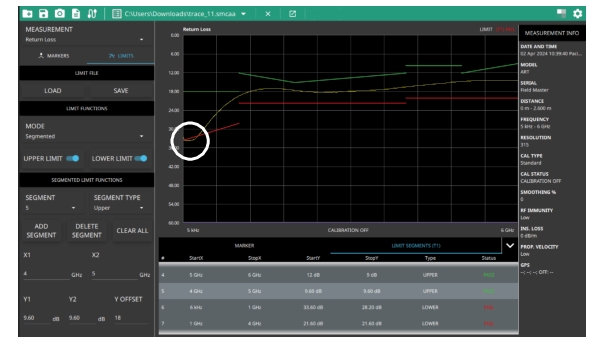
Trace Data Segment Failed
When a trace crosses a limit line segment, the entire segment line turns red indicating a failed trace response as shown in Figure: Segments - Failed. Here, several data points are below the lower limit line indicating a fail. The circle shows the trace data section that failed the specified power level region. The lower limit line turns red indicating a failure has occurred.