Scanner, Tx Test, Antenna Status and Mapping are measurements taken over the air. EMF measurements are available only with Option 444.
Antenna Status and the PBCH Modulation Results table are displayed when the Show Mod Results are set On for Scanner and Tx Test measurements. The PBCH Modulation Results table is the same numeric results table displayed in LTE Modulation Constellation and Control Channel Power measurements.
Antenna Status
The Antenna Status indicator shows the number of antennas detected and which one is currently being measured. In OTA Measurements, the Antenna Status is displayed when Show Mod Results is On for Scanner and Tx Test.
Scanner
The Scanner measurement scans for the presence of up to 6 cell IDs and the following measurement values.
Cell ID, Sector ID, Group ID
Identifying information sent by the transmitter in the sync signal.
S‑SS Power
Secondary Sync Signal power is displayed in dBm or Watts. The secondary sync signal is used to obtain frame synchronization and cell identity. S‑SS Power contains information needed for cell search.
RSRP
Reference Signal Received Power provides the UE with essential information about the strength of cells from which path loss can be calculated and used for determining optimum power settings for operating networks. RSRP is used in both idle and connected states. RSRP is used as a parameter in multi‑cell scenarios.
RSRQ
Reference Signal Receive Quality provides additional information when RSRP is not sufficient to make a reliable handover or cell reselection decision. RSRP is the ratio between RSRP and RSSI measured in dB.
SINR
Signal‑to‑Interference-plus-Noise Ratio is measured in dB.
Dominance
Dominance is the ratio of the power for the largest signal to the sum of all other signals found, measured in dB.
Tx Test
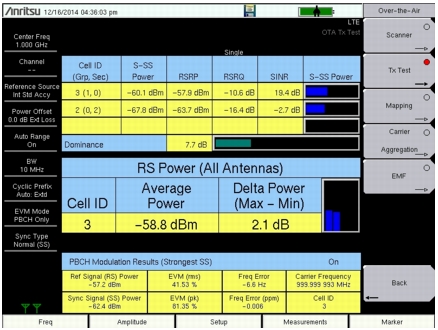
Tx Test measurements are optimized for remote radio heads and MIMO systems. The first table in Tx Test replicates the Scanner table measurements, except the measurement scans the presence of up to 3 cell IDs. The second table shows the RS power across all detected antennas (transmitters) for the strongest Cell ID. This is displayed as average power and delta power for the detected transmitters, along with a small bar graph that shows the relative RS powers for each Tx. The PBCH Modulation Results table can also be turned on.
Mapping (Coverage Mapping)
Coverage Mapping allows users to measure and map Sync Signal Power, Reference Signal Received Power (RSRP), Reference Signal Receive Quality (RSRQ) and SINR. It is the same measurement as in Scanner which scans for the presence of up to 6 cell IDs but only displays the presence of up to 3 cell IDs. For full details regarding Coverage Mapping set up and testing, refer to LTE and TD‑LTE Coverage Mapping.
Carrier Aggregation
This measurement displays a table of up to five Component Carriers (CC) used in Carrier Aggregation and their measured signal components.
Frequency
This is the set center frequency.
Bandwidth (BW)
This is the set bandwidth of the Component Carrier.
Cyclic Prefix (CP)
The length of Cyclic Prefix can be specified as either Normal or Extended. Normal CP consists of 15 kHz subcarriers while Extended CP consists of 15 kHz and 7.5 kHz subcarriers.
MIMO
The MIMO status indicators show which transmitters are active in a MIMO configuration. Active transmitters display as a green dot, inactive as grey. They correspond to the antenna icons shown at the bottom left of the screen for each Component Carrier scanned.
Reference Signal (RS) Power
Reference Signal power is displayed in dBm or Watts. The reference signal is used for downlink channel estimation.
RS Delta Power
RS Delta Power shows the maximum relative power difference in dB between the RS powers of the MIMO signals and can be used to check correct MIMO configuration.
Sync Signal (SS) Power
Sync signal power is displayed in dBm or Watts.
EVM (rms)
The RMS (%) of all the error vectors, between the reconstructed ideal signals and the received signals, divided by the RMS value of the ideal signals.
EVM (pk)
The peak (%) of all the error vectors, between the reconstructed ideal signals and the received signals, divided by the RMS value of the ideal signals.
Freq Error
This is the difference between the measured carrier frequency and the specified carrier frequency. This number is only as accurate as the frequency reference that is used, and is typically only useful with a good external frequency reference or GPS.
Freq Error (ppm)
This is the frequency error displayed in parts per million.
TAE
Time Alignment Error (TAE) is a measurement of the differential transmission delay between the Component Carriers. The 3GPP specification identifies the limits of the delays for the system to operate properly.
Cell ID
Cell identifying information sent by the transmitter in the sync signal.
EMF (Option 444 only)
EMF measurements are available in Over‑the‑Air LTE Signal Analyzer mode only when Option 444 is installed. The option requires an isotropic antenna, at a frequency range that is within specification of the instrument and antenna used. Refer to the isotropic antenna and signal analyzer technical data sheets.
EMF (Option 444) provides connection instructions for the antenna and detailed descriptions of the EMF Measurement menu and submenus.
Measurement Setup
Scanner
1. Press the Measurements main menu key.
2. Press the Over‑the‑Air submenu key.
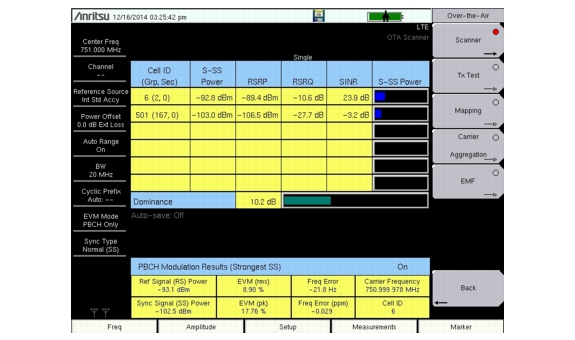
3. Press the Scanner submenu key to activate the OTA Scanner display (Figure: Over‑the‑Air Scanner Measurements). Press the Scanner key again to display the OTA Scanner menu.
a. Press the Sort By... submenu key to list the Sort By menu and select the parameter the OTA Scanner will use for sorting (Cell ID, Group ID, Sector ID, S‑SS Power, RSRP, RSRQ or SINR) and press Enter.
b. Press the Show Mod Results submenu key to display or hide the Modulation Results of the strongest signal.
Note
When Show Mod Results is on, the overall scanner measurement speed is slower due to the additional time required to demodulate the strongest signal.
Some instruments require the LTE demod option to toggle this submenu to On.
c. Use the Auto Save submenu key to automatically save measurement records. The instrument logs a data record at the end of each measurement cycle. A maximum of 10,000 records can be stored in a file.
4. Press Back to return to the Over‑the‑Air menu.
Over‑the‑Air Scanner Measurements
Tx Test
1. Press the Measurements main menu key.
2. Press the Over‑the‑Air submenu key.
3. Press the Tx Test submenu key to activate the OTA Tx Test display (Figure: Over‑the‑Air Tx Test Measurement). Press the Tx Test key again to display the OTA Tx Test menu.
4. Press the Show Mod Results key to display or hide the PBCH Modulation Results (Strongest SS) table.
5. Press Back to return to the Over‑the‑Air menu.
Note
When Show Mod Results is on, the overall scanner measurement speed is slower due to the additional time required to demodulate the strongest signal. Some instruments require the LTE demod option to toggle this submenu to On.