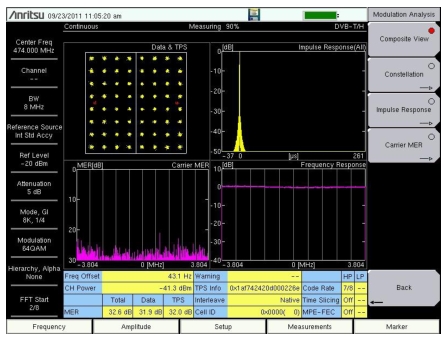
Below the measurement graphs, a measurement table provides specific measurement information, which includes: frequency offset, channel power, and MER (Modulation Error Ratio). This table is also displayed below each of the individual Modulation Analysis measurement displays. The table data is displayed even if the graphic display does not include the associated measurement data, as in Figure: Modulation Analysis, Constellation View without Graph Annotation, which displays MER data in the table but does not display graphic Carrier MER data.
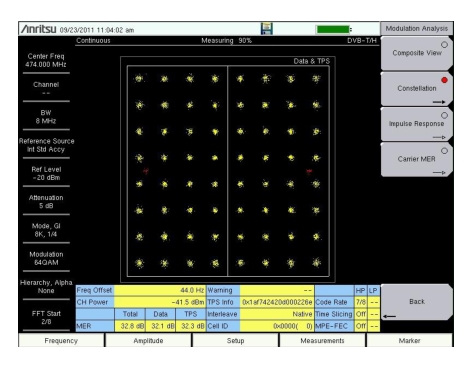
The constellation grid values and spacing depend upon the modulation and hierarchy (alpha) settings. For more information, refer to section Hierarchical Modulation.
4. Press the Back submenu key to return to the Meas Selection menu.
4. Press the Constellation submenu key again to open the Constellation menu to set up Graph Annotation.
5. Press the Graph Annotation submenu key to toggle annotation On or Off. The current setting is underlined on the submenu key. When annotation is On, grid lines are displayed in the constellation graph.
6. Press the Back submenu key to return to the Modulation Analysis menu.
Modulation Analysis, Constellation View without Graph Annotation
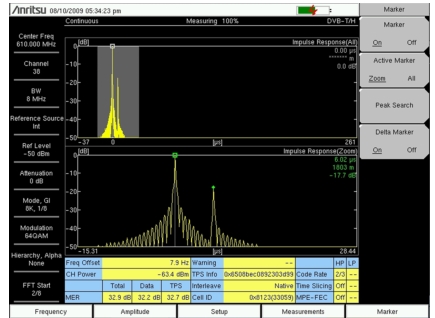
Modulation Analysis, Impulse Response View, Delta Marker ON
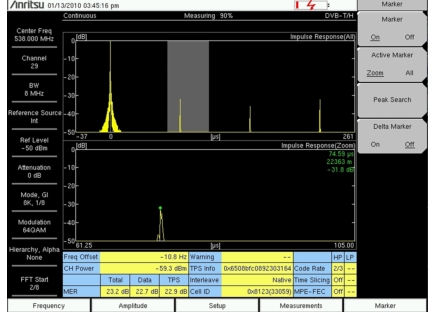
Modulation Analysis, Impulse Response View, Delta Marker OFF
1. Press the Measurements main menu key to display the Meas Selection menu.
2. Press the Modulation Analysis submenu key to open the Modulation Analysis menu.
3. Press the Impulse Response submenu key to display the Impulse Response (All) and Impulse Response (Zoom) graphs.
4. Press the Impulse Response submenu key again to open the Impulse Response menu in order to set up 0µs Position, Path_Posn_Keep, and Vertical Range.
a. Press the 0µs Position submenu key to open the Select 0µs Position list box. Select the desired position (Left, Center, Right) and then press Enter.
b. Press the Path_Posn_Keep submenu key to toggle the setting On or Off. The current setting is underlined on the submenu key. When the path position keep setting is On, the main and delayed signals are locked in place.
c. Press the Vertical Range submenu key to open the Vertical Range menu. Press one of the four submenu keys (5 dB, 10 dB, 25 dB, or 50 dB) to set the y‑axis of the Impulse Response graphs.
d. Press the Back submenu key to return to the Impulse Response menu.
5. Press the Back submenu key again to return to the Modulation Analysis menu.
Impulse Response Vertical Range
Vertical Range
Value (dB)
5 dB
0 dB to – 5 dB
10 dB
0 dB to – 10 dB
25 dB
0 dB to – 25 dB
50 dB
0 dB to – 50 dB
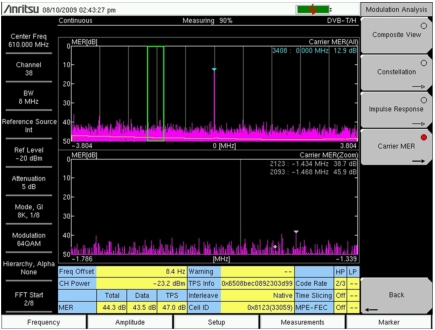
Carrier MER
The Carrier MER view displays two graphs: Carrier MER (All) and Carrier MER (Zoom). The measurement table (as described in Step 3 of Composite View) is displayed below the Carrier MER graphs. Refer to Figure: Carrier MER, which may differ from the actual screen on your instrument.
Carrier MER
1. Press the Measurements main menu key to display the Meas Selection menu.
2. Press the Modulation Analysis submenu key to open the Modulation Analysis menu.
3. Press the Carrier MER submenu key to view the Carrier MER (All) and Carrier MER (Zoom) graphs.
4. Press the Carrier MER submenu key again to open the Carrier MER menu in order to set up a vertical range and the measurement type (Speed or Accuracy).
a. Press the Vertical Range submenu key to open the Vertical Range menu. Press one of the four submenu keys (20 dB, 30 dB, 40 dB, or 50 dB) to set the y‑axis of the Carrier MER graphs.
b. Press the Back submenu key to return to the Carrier MER menu.
c. Press the Measurement Type submenu key to toggle the setting to either Speed or Accuracy. The current setting is underlined on the submenu key.
5. Press the Back submenu key to return to the Modulation Analysis menu.