When setting up the instrument for Modulation Analysis (whether viewing data in Constellation or Delay Profile display), consider the following basic measurement setup. Begin detecting a signal by setting the frequency.
General Setup
Test Selection:
1. Press the Meas Selection main menu key.
2. For modulation analysis, press the Modulation Analysis submenu key.
General Test Setup:
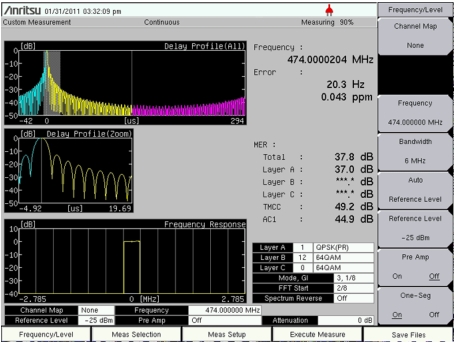
1. Press the Frequency/Level main menu key.
2. Next, choose a Channel (this automatically determines a frequency), or press Channel Map and choose “None”. If you choose “None”, then the second submenu key, Channel, is removed, and the third submenu key, Frequency, is displayed.
After setting the frequency, press the Bandwidth submenu key to select either 6 MHz or 8 MHz bandwidth. Refer to Figure: Frequency/Level Menus for Custom for a comparison of the Frequency/Level submenu keys that are displayed for different Channel Map selections.
3. After a channel (or None) is selected, the most convenient setup is available by pressing Auto Reference Level. You can also use the Reference Level submenu key to set the level manually. The Reference Level Editor dialog box displays the available range and the step value. Use the Up/Down arrow keys or the rotary knob and then press Enter.
4. With Meas Selection set to Modulation Analysis, press the Meas Setup main menu key to open the Meas Setup (1/2) menu. Then press the Detect Parameter submenu key to allow automatic setup of the top 2 settings in the Meas Setup (2/2) menu: Mode, GI and TMCC Information.
Use the Constellation and Delay Profile submenu keys to select the measurement to be displayed. You can manually set the modulation parameters, such as Mode, GI and TMCC, if you know the settings. Otherwise, you can use the Detect Parameter submenu key to have your instrument detect these parameter settings from the input signal.
Custom Modulation Analysis
Test Setup:
Configure the parameters as desired: Meas Mode, Detect Parameter, Constellation or Delay Profile, and Sub‑carrier MER.
Selecting either Constellation or Delay Profile determines the type of modulation analysis to be made and the subsequent Meas Setup (2/2) menus that are available for configuration when you press the More submenu key.
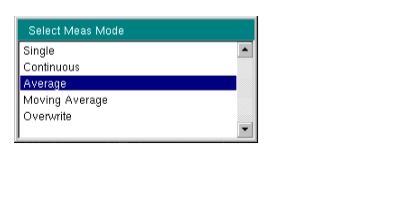
1. Press the Meas Mode submenu key to open the Select Meas Mode list box.
2. Use the Up/Down arrow keys or the rotary knob to highlight the desired measurement mode and then press Enter. Choose from: Single, Continuous, Average, Moving Average, and Overwrite. Overwrite is available only for Constellation measurement display (refer to Step 4), and is not displayed in the Select Meas Mode list box for the Delay Profile measurement display.
If Average or Moving Average is selected, then the Average Count submenu key is added to the menu. When the measurement mode is selected (and Average Count is set, if desired), continue to configure the modulation parameters at Step 3.
a. Press the Average Count submenu key to open the Average Count Editor edit box. The available range is 1 to 100.
b. Use the Up/Down arrow keys, the rotary knob, or the numeric keypad to set a value. Scroll to the desired number count or enter the value, then press Enter.
4. To continue with the measurement configuration, press either the Constellation submenu key or the Delay Profile submenu key, then press the More submenu key to open the Meas Setup (2/2) menu.
In Modulation Analysis mode, four Meas Setup (2/2) menu submenu keys are common to both Constellation and Delay Profile measurements: Mode, GI, TMCC Information, FFT Start, and Spectrum Reverse. The other submenu keys are specific to each measurement type.
Common Measurement Setup Parameters:
5. Configure the following general modulation parameters as desired: Mode, GI, TMCC Information, FFT Start, and Spectrum Reverse.
6. Press the Mode, GI submenu key to open the Select Mode, GI list box.
7. Use the Up/Down arrow keys or the rotary knob to highlight the desired parameter, and then press Enter.
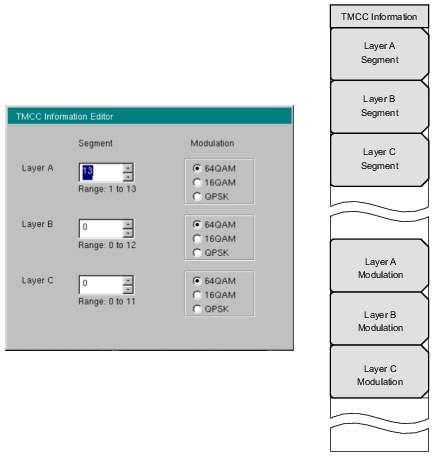
8. Press the TMCC Information submenu key to open the TMCC Information Editor dialog box and the TMCC Information menu (example shown in Figure: TMCC Information Editor Edit Box, your instrument image may differ).
TMCC Information Editor Edit Box
TMCC Information Editor:
When the TMCC Information Editor dialog box opens, the Segment value for Layer A is highlighted. To set a specific layer, press one of the submenu keys: Layer A Segment, Layer B Segment, or Layer C Segment. In the active edit box, you can change the Segment value by using the numeric keypad to enter a segment number, or by using the Up/Down arrow keys or the rotary knob.
The sum of segment values for all 3 layers must add to 13. The range of segment values for each layer is displayed below the Segment edit box of each layer.
The Modulation types for each layer are indicated by the option buttons that are adjacent to the three options: 64QAM, 16QAM, and QPSK. Set a layer modulation by pressing its submenu key (Layer A Modulation, Layer B Modulation, or Layer C Modulation). Each press of the submenu key toggles the setting to the next modulation type.
9. Set the layer segment values and the modulation types for all 3 layers.
10. Press Enter to close the TMCC Information Editor dialog box and return to the Meas Setup (2/2) menu.
A message is displayed at the bottom of the TMCC Information Editor dialog box if the “Total of segments is not 13.”
Press Esc at any time to abort the settings and return to the Meas Setup (2/2) menu.
11. Press the FFT Start submenu key to open the Select FFT Start list box.
12. Use the Up/Down arrow keys or the rotary knob to select an FFT Start value, then press Enter. Or press Esc to abort and return to the Meas Setup (2/2) menu.
13. Press the Spectrum Reverse submenu key to toggle the measurement feature On or Off. The active state is underlined.
Constellation Configuration:
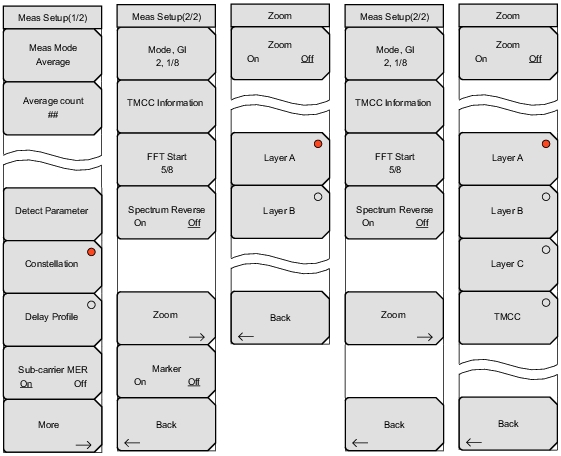
When Constellation is selected, the Meas Setup (1/2) menu includes the mode‑specific submenu key Sub‑carrier MER, and the Meas Setup (2/2) menu includes two mode‑specific submenu keys: Zoom and Marker. The Marker submenu key is displayed only when Sub‑carrier MER is On.
Constellation Setup and Zoom Menus
Making a Measurement:
When the measurement mode is set to Overwrite, the Sub‑carrier MER and Zoom submenu keys are not available. Continue at Step 4.
1. Press the Sub‑carrier MER submenu key to toggle the setting to On or Off.
2. Press the More submenu key to open the Meas Setup (2/2) menu.
3. Press the Zoom submenu key to open the Zoom menu. The Zoom function works together with the setting of the Sub‑carrier MER submenu key. Configure the Constellation measurement according to the following choices:
Sub‑carrier MER is On:
Refer to Figure: Constellation Setup and Zoom Menus. In the Meas Menu (2/2) menu, the Marker submenu key is displayed. In the Zoom menu, Only Layer A and Layer B submenu keys are displayed.
When Zoom is set to Off, three graphs are displayed: Layer A constellation, Layer B constellation, and Sub‑carrier MER. The active submenu key, shown with the red dot, highlights the associated layer graph in green.
A. With Zoom set to Off and Marker toggled to On, use the rotary knob to move the marker to the desired frequency in the Sub‑carrier MER graph.
B. When Zoom is set to On, the selected graph is enlarged, and the other layer graph and the Sub‑carrier MER graph are not displayed. Press the desired Layer A or Layer B submenu key to display the associated graph.
Sub‑carrier MER is Off:
Refer to Figure: Constellation Setup and Zoom Menus. In the Meas Menu (2/2) menu, the Marker submenu key is not displayed. In the Zoom menu, the Layer A, Layer B, Layer C, and TMCC submenu keys are displayed. The active submenu key, shown with the red dot, highlights the associated graph in green. No marker function is available.
A. Press the Zoom submenu key to toggle Zoom On or Off.
When Zoom is set to Off, four small graphs are displayed, one for each layer and one for TMCC. The active submenu key, shown with the red dot, highlights the associated graph in green.
When Zoom is set to On, the selected graph (submenu key with red dot) is enlarged.
B. To change the displayed (or highlighted) graph, Press the desired submenu key.
4. When Meas Mode is set to Overwrite, use the Detect Parameter submenu key for automatic detection, or press the More submenu key to open the Meas Setup (2/2) menu and manually configure Mode, GI, TMCC Information, FFT Start, and Spectrum Reverse (On or Off).
5. Press the Execute Measure main menu key to begin testing.
6. Press the Save Files main menu key to save measurements to file. Refer to the section, Saving the Measurement Results for more information regarding saving files
Delay Profile Configuration
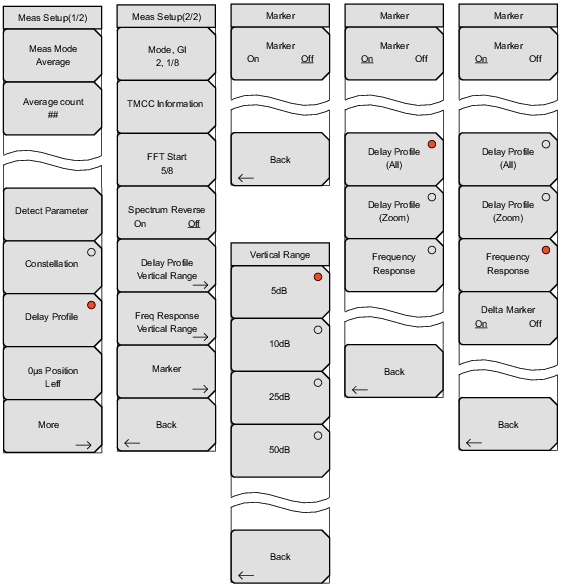
Refer to Figure: Delay Profile Setup and Marker Menus. In this configuration, 1 mode‑specific submenu key is displayed in the Meas Setup (1/2) menu: 0µs Position. Three mode‑specific submenu keys are displayed in the Meas Setup (2/2) menu: Delay Profile Vertical Range, Freq Response Vertical Range, and Marker.
The 0µs Position (zero microsecond position) submenu key opens the Select 0µs Position list box, which has three options: Left, Center, and Right. Highlight a position with the arrow keys or the rotary knob and then press Enter.
The Marker menu displays more submenu keys when Marker is On, and the Delta Marker submenu key is displayed only when the Frequency Response submenu key is active.
Delay Profile Setup and Marker Menus
Measurement Mode Selection for Modulation Analysis
Select Measure Mode List Box – Modulation Analysis
In this mode, the instrument sets the test for one measurement. Acquires the measurement and displays the results to the screen. This mode is useful for screen capture.
Continuous
In this mode, the instrument sets the test to take measurements continuously. Results are updated on the screen. This mode is helpful for real‑time signal analysis.
Average
In this mode, the instrument averages the measurement results for the specified number of measurements set in Average Count. During the measurement, the status bar at the top of the screen displays the current measurement count and average count selection. The screen displays the average of the measurements results after the final count. Refer to the submenu key description for Average Count andAverage Count.
Moving Average
This mode is useful while aiming the antenna. In this mode, the instrument takes the number of measurements set in Average Count. Then an average result is calculated from those measurements and displayed on the screen. Another measurement is taken, and another average is calculated from the last number of measurements set in Average Count. For an example of Average Count calculation, refer to Moving Average.
Overwrite (Constellation Only)
In this mode, the instrument displays the next constellation measurement result without deleting the previous constellation data. When Meas Mode is set to Overwrite, only the Meas Mode, Detect Parameter, and More submenu keys are displayed in the Meas Setup (1/2) menu, and the Zoom submenu key is no longer displayed in the Meas Setup (2/2) menu. This mode is useful for monitoring the constellation over a period of time in order to determine the worst case during that time period. This is similar to the max hold function in some other measurement modes.
Making a Measurement:
Configure the following Delay Profile parameters: Delay Profile Vertical Range, Freq Response Vertical Range, and Marker.
1. Press the 0µs Position submenu key to open the Select 0µs Position list box.
2. Use the Up/Down arrow keys or the rotary knob to highlight a position (Left, Center, or Right), then press Enter.
3. From the Meas Setup (1/2) menu, press the More submenu key to open the Meas Setup (2/2) menu.
4. Press the Delay Profile Vertical Range submenu key to open the Vertical Range menu.
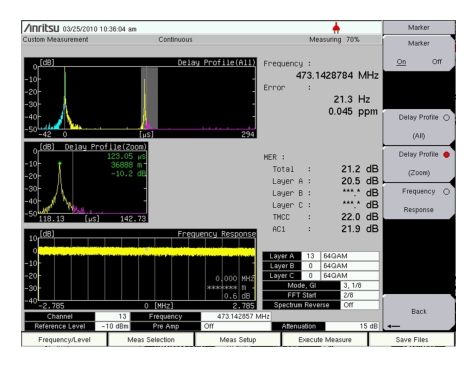
5. Press the desired #_dB units submenu key to set the y‑axis of the Delay Profile (All) and Delay Profile (Zoom) graphs. Refer to Figure: Modulation Analysis – Delay Profile for an example of these graphs.
6. Press Back to return to the Meas Setup (2/2) menu
7. Press the Freq Response Vertical Range submenu key to open the Vertical Range menu.
8. Press the desired #_dB units submenu key to set the y‑axis of the Frequency Response graph.
9. Press Back to return to the Meas Setup (2/2) menu.
10. Press the Spectrum Reverse submenu key to toggle the measurement feature On or Off. The active state is underlined.
11. Press Back again, to return to the Meas Setup (1/2) menu.
12. Press the More submenu key to open the Meas Setup (2/2) menu.
13. Press the Marker submenu key to open the Marker menu.
14. Toggle the Marker submenu key to On (if necessary) to activate the marker functions.
When Marker is toggled to Off, only 2 submenu keys are displayed: Marker and Back. When Marker is toggled to On, 3 additional submenu keys are available: Delay Profile (All), Delay Profile (Zoom), and Frequency Response. The active submenu key displays a red circle.
15. Press the Delay Profile (All) submenu key to display a green rectangle range marker in the Delay Profile (All) graph. Use the rotary knob or the arrow keys to select a range.
The range is divided within the Delay Profile (All) graph. The blue range shows signals that are delayed less than 0 µs if the largest signal (not necessarily the least delayed) is set at 0 µs. The yellow area shows delayed signals that are within the Guard Interval. The magenta area shows signals that are delayed beyond the Guard Interval (which are potentially problematic). While the Delay Profile (All) graph shows a wide range, the narrower range (that is defined by the green rectangle range marker) is displayed in the Delay Profile (Zoom) graph. The Delay Profile (Zoom) graph uses the same colors as the Delay Profile (All) graph.
16. Press the Delay Profile (Zoom) submenu key to display a green diamond marker in the Delay Profile (Zoom) graph. The delay (in microseconds), the distance (in meters), and the dB value at the marker (relative to the 0µs position) are displayed in the graph.
17. Press the Frequency Response submenu key to display a green diamond marker on the frequency response graph within the channel bandwidth. When the Frequency Response submenu key is active, the Delta Marker submenu key is displayed in the Marker menu.
18. Press the Delta Marker submenu key to toggle the Delta Marker On (if necessary). When the Delta Marker is On, it is a green diamond, and the reference marker is a green rectangle. Use the Delta Marker to display the difference in level, distance, and frequency between two points. These three values are displayed in the frequency response graph.
19. Press the Execute Measure main menu key to begin testing.
20. To save the test results, press the Save Files main menu key. Refer to the section, Saving the Measurement Results for more information regarding saving files.
The Meaning of Color in the Delay Profile Graph
The blue range (as shown in Figure: Modulation Analysis – Delay Profile) shows signals that are delayed less than 0 µs if the largest signal (not necessarily the least delayed) is set at 0 µs. The yellow area shows delayed signals that are within the Guard Interval. The magenta area shows signals that are delayed beyond the Guard Interval (which are potentially problematic).
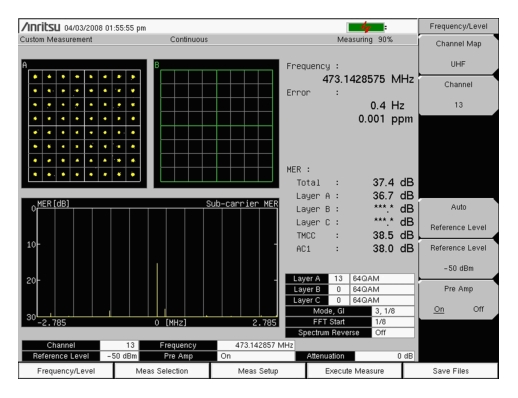
Note the existing settings in Figure: Modulation Analysis of Delay Profile, One‑Segment: Channel Map is set to None, Bandwidth is set to 6 MHz, the Pre Amp is On, and One‑Seg is set to On. At the top‑left corner of the measurement display, “Custom Measurement” indicates that Custom is the measurement selection, as opposed to Batch or Easy.
Additional settings were achieved by pressing Meas Selection and then Modulation Analysis. Also, by pressing Meas Setup and then Delay Profile.
The delay profile and frequency response graphs are displaying the measurement results for a single channel (one segment). Refer also to the TMCC Information Editor dialog box, as shown in Figure: TMCC Information Editor Edit Box.