The following P25p2 Analyzer measurements are available on the LMR Master. From the Measurements main menu press P25p2 Analyzer twice. Press the Graph Type submenu key to select the measurement type.
For input signals that are not P25p2 encoded, the LMR Master will still try to decode it and fit it to a symbol. This may cause some measurement results that are unexpected.
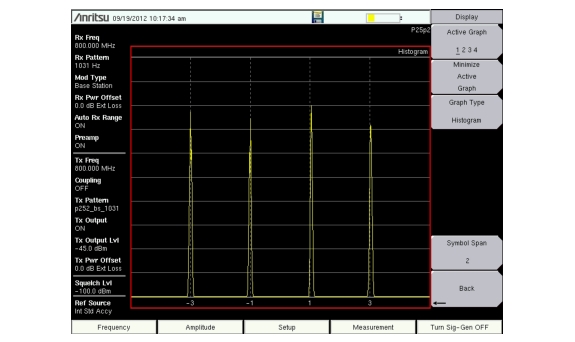
Histogram Graph
The Histogram graph displays a graphical representation of the symbols that are being received. The graph for each symbol represents the relative percentage that symbol was identified out of all the received symbols.
Each update of the screen is a separate representation of the latest data, rather than a cumulative total. The vertical scale is fixed at 0 to 100 %, with each horizontal grid line representing 10 % of the total symbols received.
P25p2 Base Station Histogram
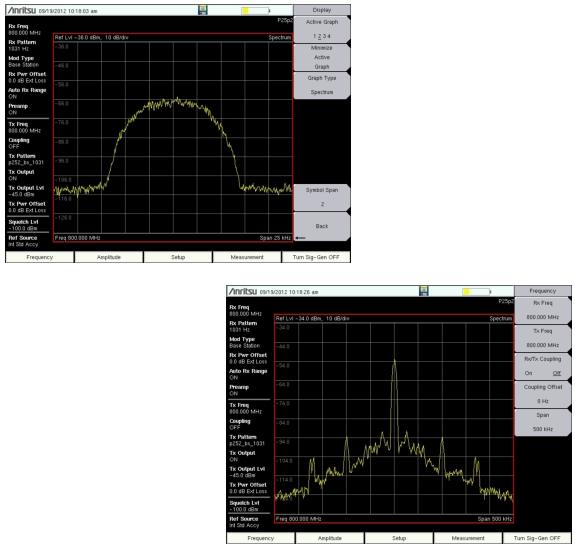
Spectrum Graph
The spectrum view displays a graphical representation of power (dBm) vs. frequency. The spectrum display gives an indication if there are interferers present that may degrade the bit error rate of the P25p2 signal. The frequency span is adjustable under the Frequency menu. The reference level is adjusted with the Amplitude menu. Refer to Amplitude Menu for details. Figure: P25p2 Spectrum Graph (25 kHz Span and 500 kHz Span) displays the same signal using a 25 kHz span and a 500 kHz span.
P25p2 Spectrum Graph (25 kHz Span and 500 kHz Span)
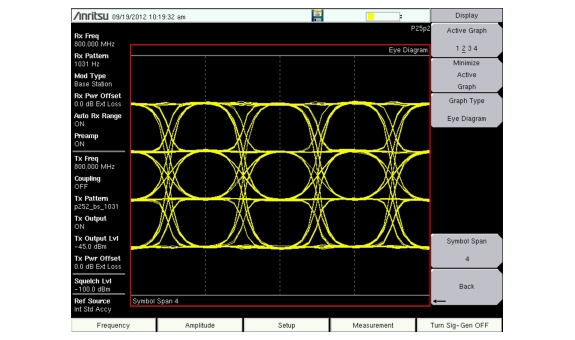
Eye Diagram
The eye diagram is an oscilloscope view of the P25p2 signal displaying the voltage of the signal vs. time. The diagram provides an indication of baseband fidelity of a P25p2 transmitter. With Over‑the‑air measurements the Eye Diagram can indicate phase distortion from multipath. The number of “eyes” displayed is set with the Symbol Span key under the Display Menu.
P25p2 Eye Diagram
Summary Graphs
The LMR Master offers several summary graphs to give a broad overview of many P25p2 transmitter details.
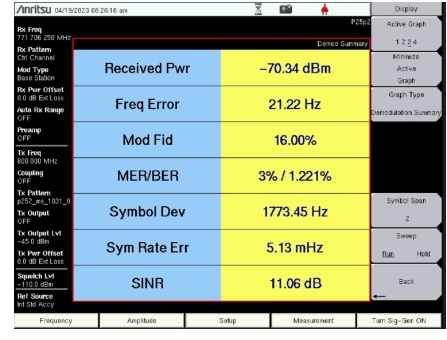
Demodulation Summary
The Demodulation Summary graph displays numeric values of received power, frequency error, modulation fidelity (Mod Fid), bit error rate (BER), symbol deviation, and symbol rate error of the input signal. When the RX Pattern is set to Control Channel, the summary graph displays message error ratio (MER/BER) in place of BER.
The Received Power value in the summary graph can be displayed in dBm, watts, or volts using the Amplitude > Units > Rx Units submenu key. This setting also applies to the squelch level setting.
The Setup > Squelch Lvl submenu key sets the squelch power level. When the Received Power is lower than the set squelch level, all summary graph measurements except for Received Pwr will be blanked out (--). When the Received Power is above the squelch level, the measurements are displayed as shown in Figure: P25p2 Demodulation Summary Graph with Received Pwr Above the Squelch Level.
P25p2 Demodulation Summary Graph with Received Pwr Above the Squelch Level
Received Pwr in the summary table is the integrated power of all the energy in the receiver bandwidth. Any peak amplitude reduction seen in the Spectrum display when compared to Received Pwr is a function of the instruments RBW setting. The reduction is specified as: 10*Log(Signal Bandwidth / Resolution Bandwidth).
Active Control Channel Summary
The Active Control Channel Summary graph can be selected only when the Mod Type is set to Base Station and the RX Pattern is set to Ctrl Channel. This summary displays the hex value of the active system ID, wide area communications network (WACN) ID, network access control (NAC), site ID, and the current site status and manufacturer ID.
P25p2 Active Base Station Control Channel Summary
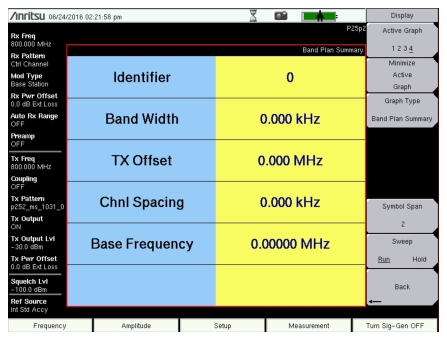
Band Plan Summary
The Band Plan Summary graph can be selected only when the Mod Type is set to Base Station and the RX Pattern is set to Ctrl Channel. This summary displays the band plan identifier, bandwidth, transmit offset, channel spacing, and base frequency.
P25p2 Base Station Control Channel Band Plan Summary
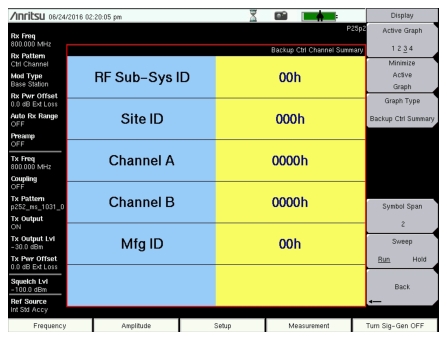
Backup Control Channel Summary
The Backup Ctrl Channel Summary graph can be selected only when the Mod Type is set to Base Station and the RX Pattern is set to Ctrl Channel. This summary displays the hex values of the RF sub-system ID, site ID, channels A and B, and the manufacturer ID.
P25p2 Base Station Backup Control Channel Summary
Adjacent Site Summary
The Adjacent Site Summary graph can be selected only when the Mod Type is set to Base Station and the RX Pattern is set to Ctrl Channel. This summary displays the hex value of the adjacent site ID, sub system ID, channel, and the relative condition (F), common state (V), and RFSS state (A).
P25p2 Adjacent Base Station Control Channel Site Summary
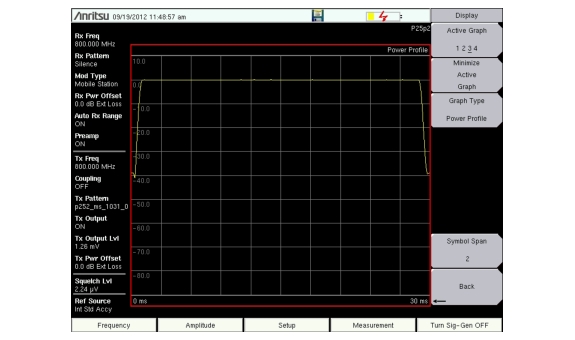
Power Profile
The power profile graph is used with Mobile StationMod Type to display a zero‑span view of power vs. time of the selected Rx Slot.