Land Mobile Radio Analyzer and Coverage Measurement Guide : P25 Phase 2 Analyzer (Option 521) : Measurement Menu
 
Measurement Menu
Key Sequence: Measurement
P25p2 Analyzer Measurement Menu
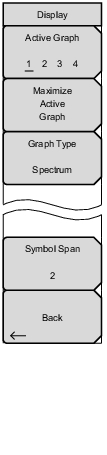
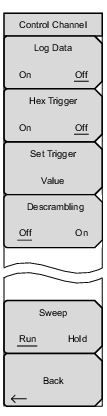
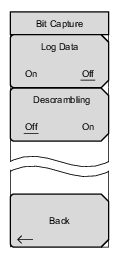
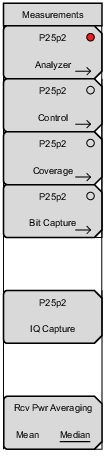
P25p2 Analyzer: Opens the Display Menu.
P25p2 Control: Opens the Control Channel Menu. This submenu key is valid only when Rx Pattern is set to Control Channel or Voice.
P25p2 Coverage (Option 522 required): Opens the P25p2 Coverage menu. Refer to LMR Coverage Mapping.
P25p2 Bit Capture: This submenu key is valid only when Rx Pattern is set to Voice. Pressing this key opens the Bit Capture Menu for data logging.
P25p2 IQ Capture: Pressing this key starts the IQ data capture. Make sure that a formatted USB flash drive is attached to the instrument before starting IQ Capture. When the capture is complete, a message is displayed. This may take a few seconds.
Rcv Pwr Averaging: Select Median to measure the RSSI value using the median of captured subsamples of Rx signal, in accordance with TIA TSB-88.3 Rev. F. Select Mean to display the RSSI value using the average of the subsamples of the Rx signal.
Display Menu
Key Sequence: Measurement > P25p2 Analyzer
P25p2 Analyzer Display Menu
Active Graph 1 2 3 4: In Four Screen view use this menu to select which of the four graphs is active. The current active graph is underlined (1 2 3 4) and has a red perimeter line. Any of the four graphs can also be made active by tapping once on the touch screen. Repeatedly pressing the Active Graph submenu key will cycle the active graph, 1 through 4.
In Standard view (one graph displayed on the screen) the Active Graphic key will rotate between the four graphs displayed in the Four Screen view.
Maximize/Minimize Active Graph: The submenu key toggles between displaying the Four Screen (4 graphs) view and the Standard view (1 graph). Tapping twice on a selected graph also toggles between the two display options.
Graph Type: The label on the bottom of this button displays the current active graph type. Pressing the button will open a list box of the graphs types available for P25p2 Analyzer measurements. Select the desired graph type with the arrow keys or rotatory knob and press Enter. The current active graph will be replaced with the new selection.
Available graphs include:
Linear Constellation
Spectrum
Histogram
Eye Diagram
Summary Graphs (demodulation, active and backup control channel, band plan, and adjacent site)
Power Profile
Refer to P25p2 Analyzer Graphs for additional information.
Symbol Span: Use this menu to adjust the number of symbols viewed across the screen in the Eye Diagram graph. Adjust from 2 and 5 using the keypad, the arrow keys, or the rotary knob. Keypad values entered outside of this range are ignored.
Back: Returns to the Measurement Menu.
Control Channel Menu
Key Sequence: Measurement > P25p2 Control
P25p2 Control Channel Menu
Log Data: Saves the measurements to an external USB flash drive. The external USB flash drive must be attached to one of the USB Type A connectors to Log data files.
The files are saved in a time‑stamped folder under the usr folder on the USB flash drive.
If Log Data is On, any of the following functions will stop the logging:
Rx Frequency change
Setup change
Starting another measurement
Hex Trigger: Turns On or Off the Hex Trigger set with the following command. Sweep will continue until the trigger value is detected. At that time Sweep will change from Run to Hold.
Set Trigger Value: Opens a touchscreen hexadecimal keyboard for setting the Trigger value.
Descrambling: Decrypts the bit capture stream based on the following parameters from the Setup (2/2) Menu:
WACN ID: Sets the Wide Area Communication Network Identifier (WACN) value the LMR Master receiver looks for in the received P25 Phase 2 transmission.
System ID: Sets the System Identifier value the LMR Master receiver looks for in the received P25 Phase 2 transmission.
Color Code: Sets the System Identifier value the LMR Master receiver looks for in the received P25 Phase 2 transmission.
Sweep: Toggles the frequency sweep of the LMR Master between Run and Hold. Save function as Shift + Sweep (3).
Back: Returns to the Measurement Menu.
Bit Capture Menu
Key Sequence: Measurement > P25p2 Bit Capture
P25p2 Analyzer Display Menu
Log Data: Enables data logging. Make sure that a formatted USB flash drive is attached to the instrument before starting bit capture. Set Log Data to On to start the bit capture. Bit capture will continue until Log Data is set to Off or the USB flash drive is filled.
The files are saved in a time‑stamped folder under the usr folder on the USB flash drive.
If Log Data is On, any of the following functions will stop the logging:
Rx Frequency change
Setup change
Starting another measurement
Selecting Log Data Off
Descrambling: Decrypts the bit capture stream based on the following parameters from the Setup (2/2) Menu:
WACN ID: Sets the Wide Area Communication Network Identifier (WACN) value the LMR Master receiver looks for in the received P25 Phase 2 transmission.
System ID: Sets the System Identifier value the LMR Master receiver looks for in the received P25 Phase 2 transmission.
Color Code: Sets the System Identifier value the LMR Master receiver looks for in the received P25 Phase 2 transmission.
Back: Returns to the Measurement Menu.