This section briefly describes TETRA Analyzer measurements that are available on the LMR Master. From the Measurements main menu press the TETRA Analyzer submenu key. If necessary, press the key a second time to show the Display menu. Press the Graph Type submenu key to select the graph type.
Constellation
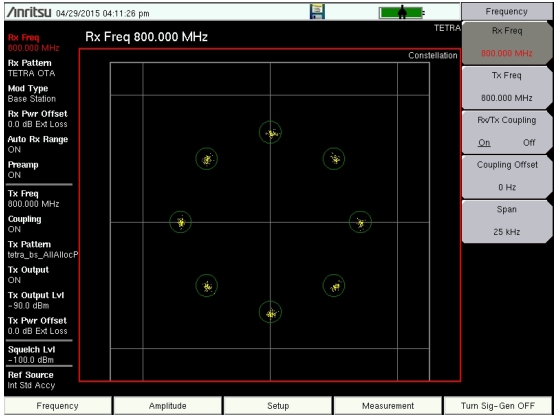
Selecting Constellation as the Graph Type displays the demodulation information in an IQ format (Figure: Constellation Diagram). Note that for input signals that are not TETRA encoded, the LMR Master will still try to decode them and fit them to a symbol. This may result in measurement values that are unexpected.
Constellation Diagram
Spectrum Graph
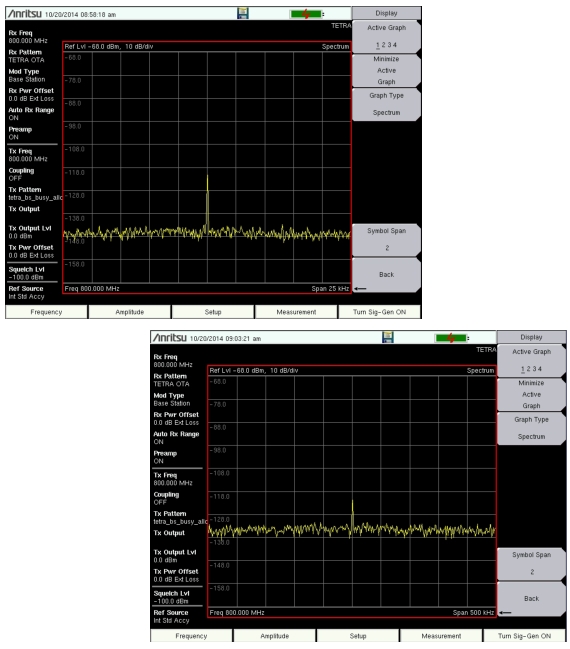
The spectrum view displays a graphical representation of power (dBm) vs. frequency. The spectrum display gives an indication if there are interferers present that may degrade the bit error rate of the TETRA signal. The frequency span is adjustable under the Frequency menu. The reference level is adjusted with the Amplitude menu. Refer to Amplitude Menu for details. Figure: TETRA Spectrum Graph (25 kHz Span and 500 kHz Span) displays the same signal using a 25 kHz span and a 500 kHz span.
TETRA Spectrum Graph (25 kHz Span and 500 kHz Span)
Eye Diagram
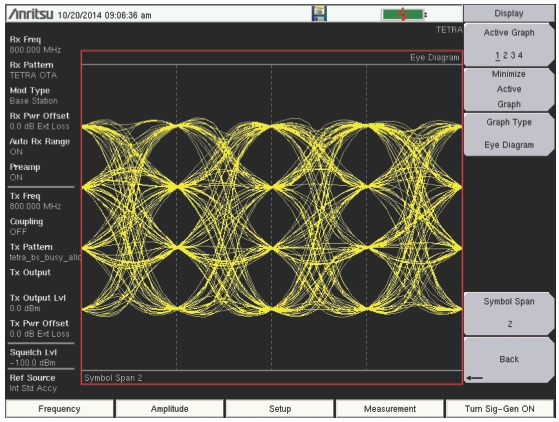
The eye diagram is an oscilloscope view of the TETRA signal displaying the voltage of the signal vs. time. The diagram provides an indication of baseband fidelity of a TETRA transmitter. With over‑the‑air measurements, the Eye Diagram can indicate phase distortion from multipath. The number of “eyes” displayed is set with the Symbol Span key under the Display Menu.
TETRA Eye Diagram
Summary and TETRA Summary Graphs
These two summary displays provide measured and decoded values in a table format.
Summary Graph
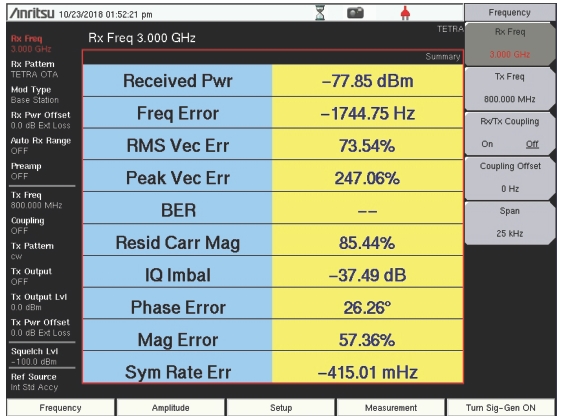
The Summary graph provides an overview of the measurements made on the signal received from a downlink TETRA transmitter. This graph displays numeric values of received power, frequency error, RMS and peak vector error magnitude (EVM), bit error rate, residual carrier magnitude, IQ imbalance, phase and magnitude errors, and symbol rate error of the input signal.
The Received Power value in the Summary graph can be toggled to dBm, watts, or volts by using the key sequence: Amplitude > Units > Rx Units. The selected unit also applies to the squelch level setting.
The key sequence: Setup > Squelch Lvl sets the squelch power level. When the Received Power is lower than the set squelch level, all values in both summary displays except for Received Pwr are blanked out (– –). When the Received Power is above the squelch level, the measurements for this graph are displayed as shown in Figure: Summary Graph (with Received Power Above the Squelch Level).
Summary Graph (with Received Power Above the Squelch Level)
Received Pwr in the Summary table is the integrated power of all the energy in the receiver bandwidth. Any peak amplitude reduction seen in the Spectrum display when compared to Received Pwr is a function of the instrument RBW setting. The reduction is specified as: 10*Log (Signal Bandwidth / Resolution Bandwidth).
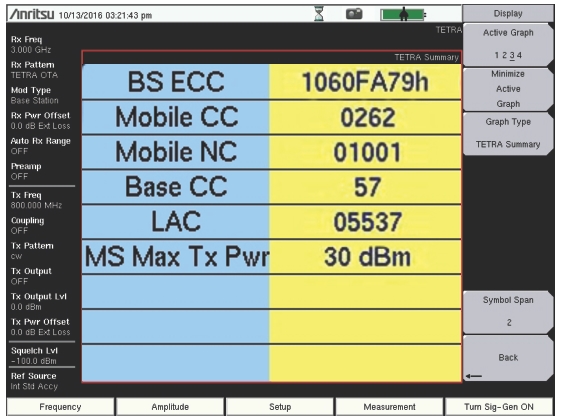
TETRA Summary Graph
The TETRA Summary graph is only available with Base Station modulation type. It reports the base station extended color code (BS ECC), mobile color code (Mobile CC), mobile network code (Mobile NC), base color code (Base CC), location area code (LAC), and mobile station maximum transmit power (MS Max TX Pwr) permitted on a channel from the TETRA transmitter.
TETRA Summary Graph (with Received Power Above the Squelch Level)
Note that BS ECC in the Summary graph is provided in 8 hexadecimal digits so that the least significant 30 bits of this value may be used for verification of corresponding bits of initial state of scramblers and descramblers of encoders and decoders, respectively, of any TETRA channel other than the Broadcast Synchronization Channel.
Note
In the Summary graph, the “h” in BS ECC 1060FA79h indicates that 1060FA79 is a hexadecimal number.