 |
Note | Recalled measurements may change the current instrument settings. |
|
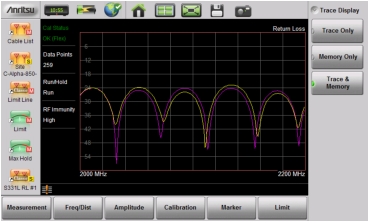 |
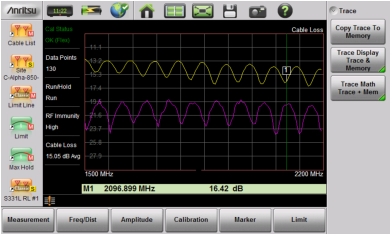
Note | The trace from memory can be displayed only if the measurement settings (except for Amplitude) have not changed since the trace was copied to memory. If one of the traces is cut off, then pressing Amplitude > Fullscale adjusts the reference level to display both traces. |
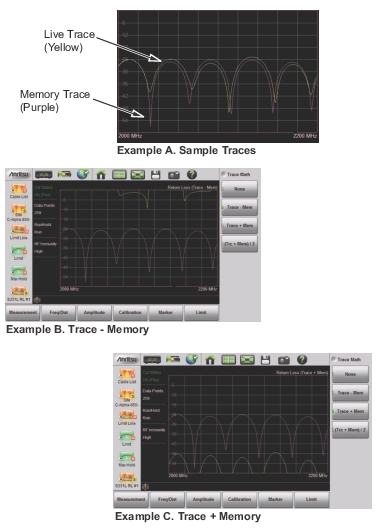 |
Notes | The trace math functions often seem backwards to new users. The points to remember with Trace ‑ Memory, Trace + Memory, and (Trc + Mem) / 2 are: • The numbers on the y‑axis are negative. • The purple trace is added to or subtracted from the live trace. The sum or difference of the live trace and memory trace is displayed in yellow. |
Example | Example Description |
A. Sample Traces | Shows the live yellow trace and purple memory trace. |
B. Trace ‑ Memory | In the Trace – Memory graph, the yellow trace is the result of subtracting the purple memory trace from the active trace. (The active trace is displayed in Example B, Trace – Memory as the yellow trace, and appears different because trace math is applied to it.) Note that the yellow Trace – Memory is at 0 or above (and off the graph) whenever the yellow trace (as shown in Example A) is above (has a greater value than) the purple trace. The two down sloping bumps in Example B are when the purple trace (in Example A) moves above the yellow trace. In Trace – Memory, this results in a negative value being displayed. |
C. Trace + Memory | In the Trace + Memory graph, the yellow trace is the result of adding the purple trace to the active trace. (The active trace is displayed in Example C, Trace + Memory as the yellow trace, and appears different because trace math is applied to it.) Note that the yellow Trace + Memory is below 60 (and off the graph) whenever adding the yellow trace value to the purple trace value is greater than 60 (refer to Example A). |
(Trace + Memory) / 2 (not shown) | In the (Trace + Memory) / 2 graph, the yellow trace is the result of adding the purple trace to the active trace and then dividing the result by 2. This math function is most useful when measuring one‑port Cable Loss (using the Cable Loss measurement). 1. Connect a Short to the end of the cable and store the trace into memory. 2. Next, connect an Open to the end of the cable and apply (Trc + Mem) / 2 math function. Because the ripple generated by the Short and Open are 180° out of phase, the effect of this math function will be to cancel out the ripple, resulting in a more accurate cable loss measurement. |