Click a map source to use in the map display, Baidu maps or a map from Open Source Maps. If using Open Source Maps, then switch to Baidu Maps and want to return to the same Open Source Map, just click Show Current OSM Map to view the same OSM map without reloading. To view the list or load a new OSM map, click Installed Map Files. Click to load the new OSM map.
Open Source Maps (User Provided): Directs user to Open Source Map file location.
Show Current OSM Map: Displays the current Open Source map.
Installed Map Files: Displays the file directory of the user installed map files.
Open Map Image File (User Provided): Browse for a map file to load.
Installed Map Image Files: Provides a sub menu with existing map files in the default map folder. (Documents\Anritsu MapFiles)
Import Base Stations (Open Source only)
Opens the Import Base Station dialog to load a list of base stations onto the driving map. The file with the extension .lst is a text file which contains the latitude, longitude and the name of the site. This file can only be overlaid onto OSM map files. Refer to Creating, Importing, and Viewing Base Stations (Open Source Only).
Opens the MIH Connection Setup dialog to set up the Ethernet connection to an Anritsu spectrum analyzer.
1. Enter the IP address of the instrument.
2. Click Test Connection to confirm connectivity.
3. Click OK to return to the main screen.
GPS Configuration
For Anritsu Handheld instruments without an internal GPS receiver, this setup allows you to use an external USB GPS antenna. The default setting is Instrument GPS. See Setting Up an External USB GPS Antenna.
Power Detection Mode
This menu becomes available after connecting to a MS2090A through the Spectrum Analyzer Connection menu. Used when performing flux density measurements. See the detailed description at Flux Density. The submenus are:
1. Channel Power
2. Flux Density (dBm/m2/MHz)
3. Flux Density (dBW/m2/MHz)
Audio Tones
Tones fluctuate in pitch relative to the power level received which can be seen in the Real-Time Power Meter. The higher the power level the higher the tone pitch and most likely the closer the interferer signal. The audio tone update is approximately once every 100 ms but is considerably slower if the Spectrum Display is on.
Voice Prompts
Voice Prompts are given at fifteen second intervals and will point you in the general direction towards the interference source. When activating Voice Prompts, a voice will inform you that Voice Prompts is on.
Voice Selection
Mobile InterferenceHunter provides options for voices to use as voice prompts. Click:
• Microsoft David Desktop
• Microsoft Zira Desktop
Other voices are commercially available from various vendors should you find the Microsoft voices not understandable.
Min/Max Hold
Click to display sub-menu with Normal Trace, Min Hold, or Max Hold functions. A timer control located at the top corner of the MIH window appears, as shown in Figure: Min/Max Timer Control, when Min/Max is selected and can be set from 1 to 15 seconds.
Note
Using this feature lengthens the data collection time. You will need to reduce your driving speed.
Min/Max Timer Control
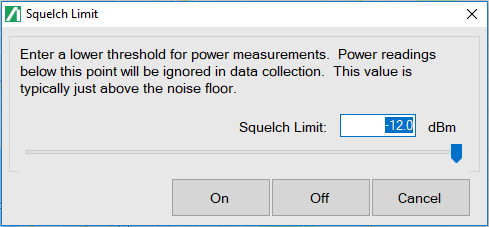
Squelch Limit
Displays the dialog shown below. Set a minimum power signal threshold with squelch limit. Click On to activate the squelch limit value. This value appears with the Squelch Limit menu in the Setting menu list.
Any signal below squelch limit will be ignored during the data collection. This value is typically a few dB above the instrument noise floor. Measured with Channel Power for the current setup. Refer to Allow Level Adjustments control in the View Menu for doing this post-acquisition.
The squelch limit value will appear with the Squelch Value menu in the Setting menu list.
Sensitivity
Sensitivity relates to how data is collected in different types of geographical areas. In urban areas, small fluctuations in the receive power are more likely to be caused by a reflected or attenuated signal. We do not want to use these fluctuations in the location algorithm, so we lower the sensitivity by smoothing the data set. In rural areas there are fewer obstacles so small changes in the receive power are more likely to be of interest. We use higher sensitivity (less smoothing) so these small changes can help locate the interference source.
In urban canyon settings, the GPS signal can suffer from multi-path, and a stopped vehicle can appear to wander some distance from its true location. Decreasing sensitivity in urban areas increases the minimum distance the vehicle’s position must change to be considered moving. In the case of 0, No Sensitivity (zero averaging), the data displayed will be raw data taken. No averaging has been applied to the data collected. Select the environment type that closely resembles the area that an interferer is being hunted. Sensitivity is only used for Single and Multiple emitter Modes. It does not apply to Spectrum Clearing Mode.
Along with the Sensitivity settings there is a Peak Detection Threshold setting. Before a location estimate is made, it is important to have enough useful data that an estimate is of value. The algorithm requires a peak in power to be detected, indicating that you have at least driven somewhere in the neighborhood of the interference source. If the threshold (power above background) for this peak is too low you will get false positives, meaning a location estimate based on multi-path or other environmental effect, rather than the true interferer location.
When seeking low power sources, it is sometimes necessary to lower the peak detect threshold in order to get a position estimate at all. Generally, it is best to start with the Peak Detect Threshold set to High, and only lower it if you feel certain you are in the right area, but still not seeing a location estimate.
Both the Sensitivity and Peak Detect Threshold affect calculations over the entire data set each time a new value is added. The raw power levels are kept in memory. Therefore, changing settings during a hunt is perfectly fine. The new value will be applied to the entire data set, and changes are reversible.
Search Grid Width
Changing this setting widens (or narrows) the search grid, the area in which an RF source searched. If the RF source is outside of this area, as indicated by a box drawn on screen, it will not be located by MIH. MIH only looks inside the search grid area for an interferer. This setting has the same effect on both estimation circle and heat map mode.
Log Data While Stopped
Normally, the Mobile InterferenceHunter will not collect data when you come to a stop, for example, when stopped at a street light, pulled over for a moment to change settings or to get a better view at the map. When selected, Log Data While Stopped allows you to continue collecting data when not moving. The minimum speed for data collection varies with the Sensitivity setting, ranging from 2 m/s to 10 m/s. The data collection interval significantly reduces below that speed.