 | |
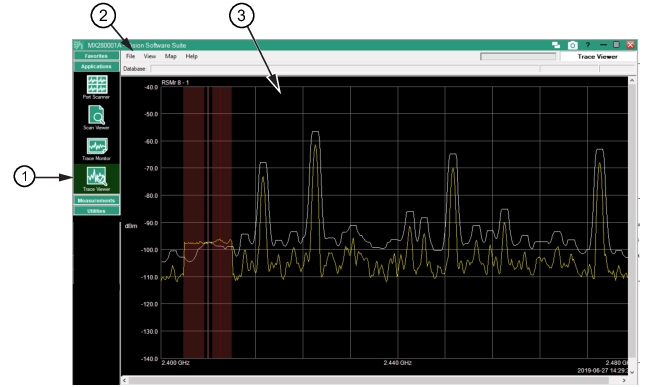
1. DB Trace View Icon 2. Menu Toolbar 3. Trace View |
 | |
1. DB Trace View Icon 2. Menu Toolbar 3. Trace View |
Menu | Description |
File | Open Database Opens the database folder that has been set from “Set Database Root Folder”. Set Database Root Folder Opens the database folder set the “Set Database Root Folder”. Open Windows List Open the recently viewed windows list. Save Windows List Save and close the recent windows list. Recent Databases Click to display the most recent databases used. Exit Exit the File menu. |
View | View Mode: Opens the context menu shown below.  Trace View: Set all windows to Trace View mode. Toggle individual windows to spectrogram view by clicking on their displayed graph. Spectrogram View: Set all windows to spectrogram view mode. Toggle individual windows to trace view by clicking on the graph. Live View: Set all displayed channels to Live View. Synchronize Traces Synchronize all displayed channels. Scrolling through one channel will scroll through all displayed channels in time. Arrange Windows Arrange and resize all displayed channel windows to fit to the main Trace Viewer window. |
Report | Generate Failure Report Contains data sections of accumulated failures from the Last Pass, Past Hour, Past Day, Past Week, and Past Month. See Figure: Generate Failure Report. Export Failure Report Export the failure report to a set file location. Network Health Check Network Health Check Browse Report Archive Report Options. Opens the browser dialog. Report Options Set the Failure Report, Occupancy Report and Export Field Delimiter Options. See Trace Monitor Report Options. |
Map | Load Map Load a customer selected map to the screen. Existing Maps Load a map from an existing map folder. |
Help | Help |