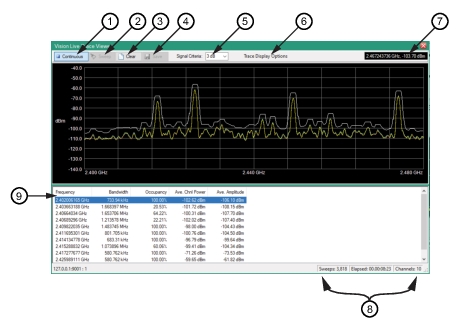
Live Data Stream provides a user interface screen to view a live stream of trace data. The live trace parameters are displayed also.
Live Trace Viewer
1. Continuous
2. Sweep
3. Clear
4. Save
5. Signal Criteria
6. Trace Display Option Pull-Down Button
7. Mouse Marker Readout Field
8. Metrics Log (Sweeps, Elapsed, Channels)
9. Traces Parameters Field
Click to continually collect trace data. Click again will stop trace data collection.
Sweep
Click to generate and capture a single sweep.
Clear
Click to clear all results.
Save
Click to save the resulting sweep data in either HTML or Tab delimited format.
Signal Criteria
Click to set the criteria for determining peak thresholds in the trace data.
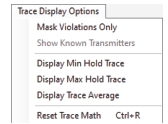
Trace Signal Display Pull-Down Button
Click to open menu list below.
Mask Violations Only: Click to check the box to include only the traces that violate a mask in the results table.
Show Known Transmitters: Click the box to display the known transmitters within the bandwidth of the displayed trace. This box will remain grayed until known transmitter files have been loaded. A user created list of known transmitters is required to be loaded first before they will be available to display. This is achieved from within the Trace Monitor trace display window via the Transmitter Menu Button menu. For more information on loading a known transmitter file, SeeLoading the Known Transmitter (.lst) File.
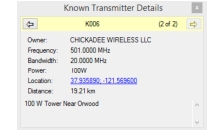
Once the user created list of known transmitters has been loaded and then selected, any known transmitters will appear as white vertical lines above the trace. Selecting one of these lines will display a dialog box with the transmitter details. See Figure: Known Transmitter Details.
Known Transmitter Details
Display Min Hold Trace: Shows the cumulative minimum value of each display point over many trace sweeps. Can be applied to only one channel monitor in the database.
Display Max Hold Trace: Shows the cumulative maximum value of each display point over many trace sweeps. Can be applied to only one channel monitor in the database.
Display Trace Average: Shows an exponential average of a number of traces, determined by the number of Averages. Can be applied to only one channel monitor in the database.
Reset Trace Math: Clears the three options – Min Hold, Max Hold and Trace Average. It turns these three off, if they are turned on.
Mouse Marker Readout Field
The signal’s frequency and amplitude correlating to the mouse location on the display.
Metrics Log
When either in continuous sweep or paused, selecting the Clear button will reset the Sweeps and Channel count to zero.
Sweeps: Records the number of continuous sweeps. The sweep count stops when the sweep is stopped and continues from when a sweep is restarted.
Elapsed Time: Records the elapsed time that starts when the Continuous button is pressed. The elapsed time restarts at zero seconds when restarted.
Channels: The number of channels displayed in the trace parameters field. These signals displayed are filtered per the Signal Criteria set.
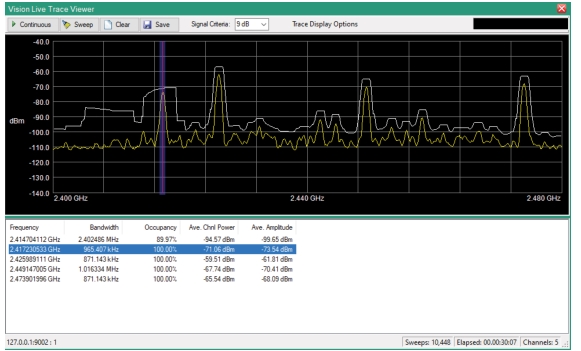
Trace Parameters Field
The Trace Parameter Field displays each signal parameter.
Frequency: Signal Frequency
Bandwidth: Signal Bandwidth
Occupancy: Percent of Occupancy
Ave. Chnl Power: Average Channel Power
Ave. Amplitude: Average Channel Amplitude
To view a frequency and its associated bandwidth on the sweep spectrum, click Continuous a second time to pause the sweep. Click a readout in the Trace Parameters Field to view the marker frequency and bandwidth on the user interface screen. See Figure: View Selected Sweep.