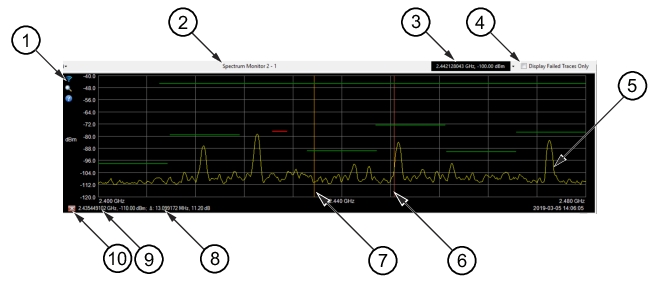
When a channel is selected, the last trace collected in the database is displayed. Use the Scroll bar at the bottom of the display to view all of the other traces for the selected channel and base station. The Trace Panel shown in Figure: Trace Panel is an example of a Trace Matrix block that contains only one trace. The bar above the trace display will display the monitor and channel, frequency and amplitude at the cursor location, and a selection box to display only failed traces. The power displayed is the power at that frequency and not at the location of the cursor.
Display Failed Traces Only
If the Display Failed Traces Only box is checked, only traces that failed the limit line mask are shown in the trace display, spectrogram, and trace-matrix. Markers can be set by placing the cursor at a desired location and clicking the left mouse button. An orange horizontal marker appears indicating frequency and amplitude of that location. A second red delta marker, can be displayed by holding down shift key and clicking at any other location on the trace display. Frequency and power delta information will display right of the main marker information under the x-axis. See also Figure: Trace Matrix with One Trace Per Block.
Click to locate the Transmitter locations on the Monitor map.
Show Transmitters on Map
Click to display three methods of viewing a transmission as shown below.
Show Selected Transmitter on Map: Displays a single target receiver marker on the map, corresponding to the selected transmitter in the trace display. Click a vertical line representing the frequency of a known transmitter and see the location on the map.
Show Transmitters in Active Frequency Span: Displays the target receiver markers for each known transmitter listed in the loaded file that transmits in the frequency range of the currently selected target receiver/channel, as displayed in the trace window.
Show All loaded Transmitter Locations: Displays a target receiver marker on the map for all of the transmitters in the loaded file of known transmitters.
Load From File
Click to load file to view transmitter coordinate information.
Clear List
Click will remove all listed Transmitter information.
Transmitter Line Color
Opens a sub-menu with color choices to change the Transmitter line color as shown below. Click White, Blue, Green, Red, Orange, or Brown.
Zoom
Zoom function allows the user to see the trace at full resolution - 1 data point per pixel column on the display. If a set marker is active, the zoom will focus a 200 pixel bandwidth around the set marker. If both the set marker and delta marker are active, the zoom will center on the set marker only. For example, trace data at 2000 trace points, but the trace window is only 500 pixels wide, the data points are crunched together. Zoom opens up the data points around the marker, and then crunches distant points more.
Marker Help
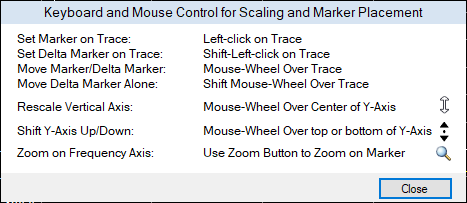
Provides the following dialog that contains marker and scaling instructions.
Marker and Scaling Instruction Dialog
If you click a block in the Trace Matrix that contains more than one trace, all the traces for that block are drawn simultaneously in the trace panel. See Figure: Trace Matrix with Multiple Traces per Block.
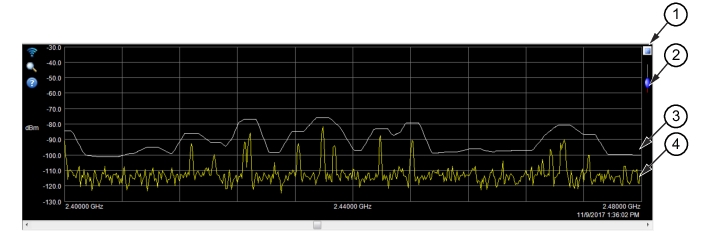
Trace Mask Panel
1. Sweep Control On/Off Button
2. Speed Control Scroll Bar
3. Trace Mask
4. Spectrum Monitor Trace Display
Sweep Speed Control On/Off Button
Initiates an active sweeping trace displayed on the Spectrum Monitor Screen.
Sweep Speed Control Scroll Bar
The speed control scroll bar becomes available when the “sweep control on/off button” is selected. The speed control scroll bar provides a sweep speed control of the trace. Click and slide the bar up to increase the trace sweep speed or slide the bar down to reduce the sweep speed.