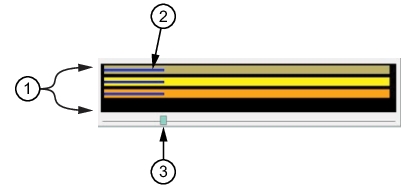
The time offset bar displays time offset of the three data files as shown in
Figure: Signal Parameters Window. Each colored bar corresponds to the colored file name field displayed in
Figure: Center Frequency and Capture Bandwidth. Note that the length of each data file in the file parameter window is 1.000 sec and is therefore the length of the bar represented in the graph. The time location in the Time Offset Graph is represented as a percentage of the sweep. The progress shows that each file sweep is at about 200 ms of time as indicated by the bar length. The signal peak of each graph occurs at a different segment of time. Initially, the signals are not synchronized. To view each signal as synchronized, adjust each signal to find the peak, then press the underlined “Playback Offset” button of each signal at the time offset. Although the signal length is 1.000 sec, the slider is used to find the Playback Offset as described in
Finding the Offset.