- 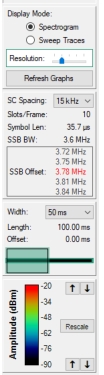 | Display Mode Provides Spectrogram or Sweep Trace Modes for 5G Frame Analysis. Spectrogram Display the Spectrogram view of the analyzed signal. Displayed when the Spectrogram radio button is selected and the Generate Graphs button is pressed. Sweep Traces Display the Sweep Traces (density plot) view of the analyzed signal. Displayed when the Sweep Traces radio button is selected and the Generate Graphs button is pressed. Resolution The Resolution slider is available when in Spectrogram mode. Use the slider to adjust the resolution of the spectral display. Press the Refresh Graphs button to update the display. Ref. level The Reference Level window shown below is available when in Sweep Trace mode. Use the Reference Level window to adjust the power level of the sweep trace display. Press the Refresh Graphs button to update the display. Refresh Graphs Press to refresh and view the Spectrogram mode display or Sweep Traces mode display. SC Spacing Use the drop-down to set a Subcarrier Spacing (SC). The set SC Spacing adjusts the Slots/Frame, Symbol Length, and SSB BW of the capture criteria. SSB Offset The (SSB) offset window provides the frequency readout of the SSB. Click an offset to display the dialog box shown below. See Send SSB to Signal Analyzer. 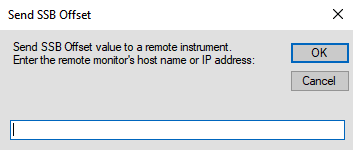 Width Set of the spectrogram time axis view bandwidth as 10, 20, 30, 40, or 50 ms. Length Total file length of spectrogram view. Offset Use the slider to scan the spectrogram length in time (ms) (Width set). Color Density Spectrogram Mode: Use the top arrows to adjust the spectrogram power reference color to be lighter or darker. Use the bottom arrows to adjust the signal power reference scale density. Sweep Traces Mode: The color density plot provides a visual of the power level density of the displayed trace. There are no adjustments in Sweep Traces mode. Rescale: Press to autoscale the color map in Spectrogram mode. |