The instrument can display up to 6 traces simultaneously. Traces can be enabled from the TRACE menu by selecting the trace from the available selections, or you can select a trace in the Status panel to make it active. Each trace can have a separate trace type, mode, and detector. When working with traces in RF spectrum view, refer to TRACE Menu.
Traces in WCDMA
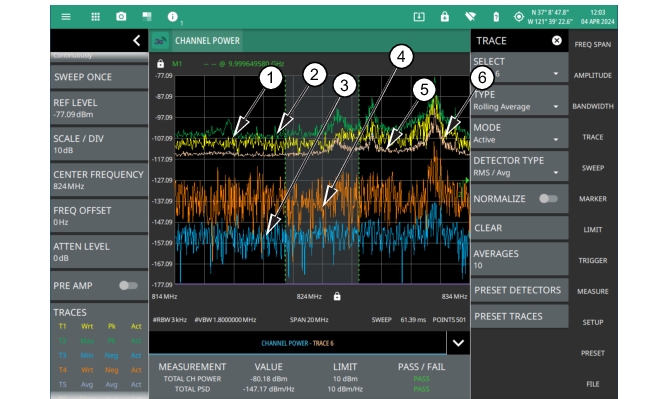
The figure below shows all six traces enabled on a signal, each with a different trace or detector type setting. The left side status panel shows a trace setup summary table. Touching one of the trace rows in the table will enable the trace and open the TRACE menu.
Traces – RF Spectrum View
1. Clear/Write and Peak Detection: This is the default trace setting. The trace is cleared during each sweep and the largest measurement point is used for each display point.
2. Max Hold and Peak Detection: Each trace point retains its maximum value and the largest measurement point is used for each display point.
3. Min Hold and Negative Detection: Each trace point retains its minimum value and the smallest measurement point is used for each display point.
4. Clear/Write and Negative Detection: Trace points are cleared during each sweep and the smallest measurement point is used for each display point.
5. Average and RMS/Average Detection: The trace points are an average of the previous N sweeps, where N is the AVERAGES setting. RMS/Average detection depends on the video bandwidth type setting (BANDWIDTH > VBW TYPE): When VBW/AVERAGE type is set to Linear, this method detects the average power of measurement points that go into the display point. When VBW/AVERAGE type is set to Logarithmic, the traditional average of log (power) is displayed.
6. Rolling Average: The rolling average of the last N traces, where N is the AVERAGES setting.
Trace Math
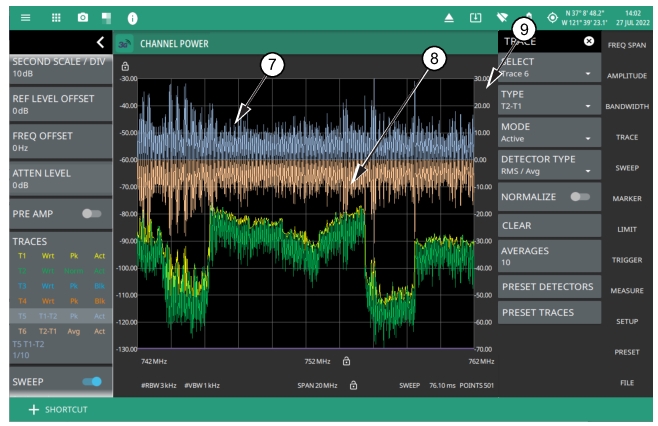
The figure below shows the instrument with trace 5 and 6 enabled on a signal, each with a different trace or detector type setting. The left side status panel shows a trace setup summary table. Touching one of the trace rows in the table will enable the trace and open the TRACE menu. In trace math, the T2-T1 or T1-T2 operation performs a division of the linear powers (watts) of trace 2 divided by trace 1 and vice versa, this is equivalent to the subtraction of the log powers (dBm). The operation does not change depending on the amplitude units and the resulting math trace is always in dB. When a math trace enabled, a secondary Y axis appears on the right side of the trace window. Most measurements are incompatible with dB values and will stop updating when a math trace is the active trace. Limit lines on math traces interpret their values as (dB).
Trace Math – WCDMA Channel Power Measurement
7. T1-T2: Appears only when Trace 5 is enabled. When selected displays the difference between T1 and T2, in addition to the second Y axis on the right hand side.
8. T2-T1: Appears only when Trace 6 is enabled. When selected displays the difference between T2 and T1, in addition to the second Y axis on the right hand side.
9. Second reference level: Appears only when Trace 5 or 6 are selected and Trace Type is set as either T1-T2 or T2-T1.
Trace Normalization
Trace normalization.
Trace Normalization
1. T1N: Normalized Trace
2. Normalize: Toggle it to view normalized trace.
TRACE Menu
The TRACE menu is only available for RF measurements (trace display). Refer to WCDMA Measurement Setup.
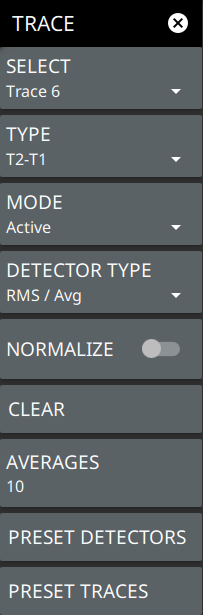
TRACE Menu
SELECT
Selects traces 1 through 6. Selecting a trace that is off turns the trace on. The trace type will be Clear/Write, the trace mode will be Active, and the detector type will be Peak. Selecting a trace will draw the trace on top of all other traces. This feature is not available in the spectrogram measurement view because all spectrogram data is created from a single trace.
TYPE
Selects one of the following types of traces:
• Clear/Write: Clears the trace after each sweep is complete and writes a new trace.
• Average: The exponential average of all N traces, where N is the AVERAGES number set below. The number of sweeps is displayed in the status panel TRACES table.
• Max Hold: Represents the maximum value since sweeping began. The number of sweeps is displayed in the status panel TRACES table.
• Min Hold: Represents the minimum value since sweeping began. The number of sweeps is displayed in the status panel TRACES table.
• Rolling Average: Is the rolling average of the last N traces, where N is the AVERAGES number set below. The number of sweeps is displayed in the status panel TRACES table.
• Rolling Max Hold: Is the maximum rolling average value of the last N traces, where N is the AVERAGES number set below. The number of sweeps is displayed in the status panel TRACES table.
• Rolling Min Hold: Is the minimum value of the last N traces, where N is the AVERAGES number set below. The number of sweeps is displayed in the status panel TRACES table.
TRACE MODE
Selects one of the following trace modes:
• Active: Displays the selected trace as it is updating.
• Hold/View: Displays the trace and it is not updating. It displays the last sweep from when the trace mode was set to hold/view. If the frequency or bandwidth settings are changed while a trace is in hold/view mode, the data will be blanked from the screen. In order to see data again, set the trace mode to active.
• Blank: Does not display the trace and is not updating. It is the same as if the trace was off.
NORMALIZE
Toggles the trace normalization on/off. Note that when the toggle is turned on selected trace in the status panel is indicated by a subscript of the letter ‘N’. Refer to Figure: Trace Normalization
DETECTOR TYPE
Selects one of three detector types. Several detection methods tailor the function of the instrument to meet specific measurement requirements. There are often more measurement points across the screen than display points. The various detection methods are different ways of dealing with how measurement points will be shown at each display point.
• Peak: This method causes the highest amplitude measurement point to be shown for each display point, assuring that a narrow peak is not missed.
• RMS/Avg: In the default case, when the VBW/AVERAGE type is set to Linear, this method detects the average power of measurement points that go into the display point. When VBW/AVERAGE type is set to Log, the traditional average of log (power), such as dBm, is displayed for the detector, as well as for VBW and trace average.
• Negative: This method causes the lowest amplitude measurement point to be shown for each display point. This method is also useful when looking at modulated signals, to see if some frequencies are not being used.
• Sample: Shows the transient amplitude of the center of sampled data for each display point. This method is useful when measuring low-level signals and noise measurements. Only available in zero span and RSSI measurements. When Sample detector is selected, all traces must use sample detection.
CLEAR
Clears the currently active trace data.
AVERAGES
Sets the number of trace sweeps (N) to average. Available when the trace type is set to one of the averaging modes.
PRESET DETECTORS
Sets all trace detectors to Peak.
PRESET TRACES
Presets cursor and trace setup to Clear/Write, Active, with Peak Detector.
Trace Detector Types
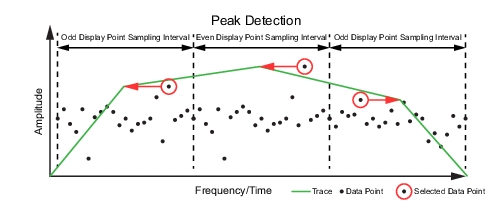
The figure below illustrates how the available detector types determine a trace data point from the sampled data
Peak Detector
Shows the maximum amplitude of sampled data for each display point, assuring that a narrow peak is not missed.
Peak Detector Type
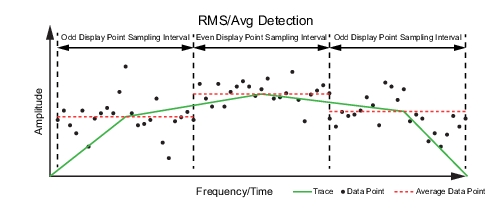
RMS/Avg
In the default case, when the VBW/AVERAGE type is set to Linear, this method shows the linear average amplitude of sampled data for each display point, before converting to display units. When VBW/AVERAGE type is set to Log, this method shows the traditional average of log (power), such as dBm for each display point, before converting to display units. Not available in zero span.
RMS/Avg Detector Type
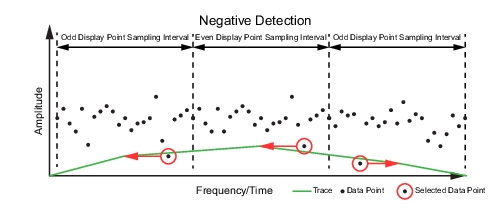
Negative
Shows the minimum amplitude of sampled data for each display point. This method is also useful when measuring modulated signals to see if some frequencies are not being used.
Negative Detector Type
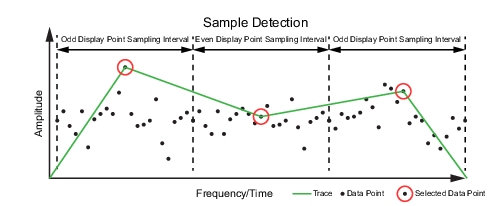
Sample
Shows the transient amplitude of the center of sampled data for each display point. This method is useful when measuring low-level signals and noise measurements. Only available in zero span and RSSI measurements.
Sample Detector Type
Note
When Sample detector is selected, all traces must use sample detection.